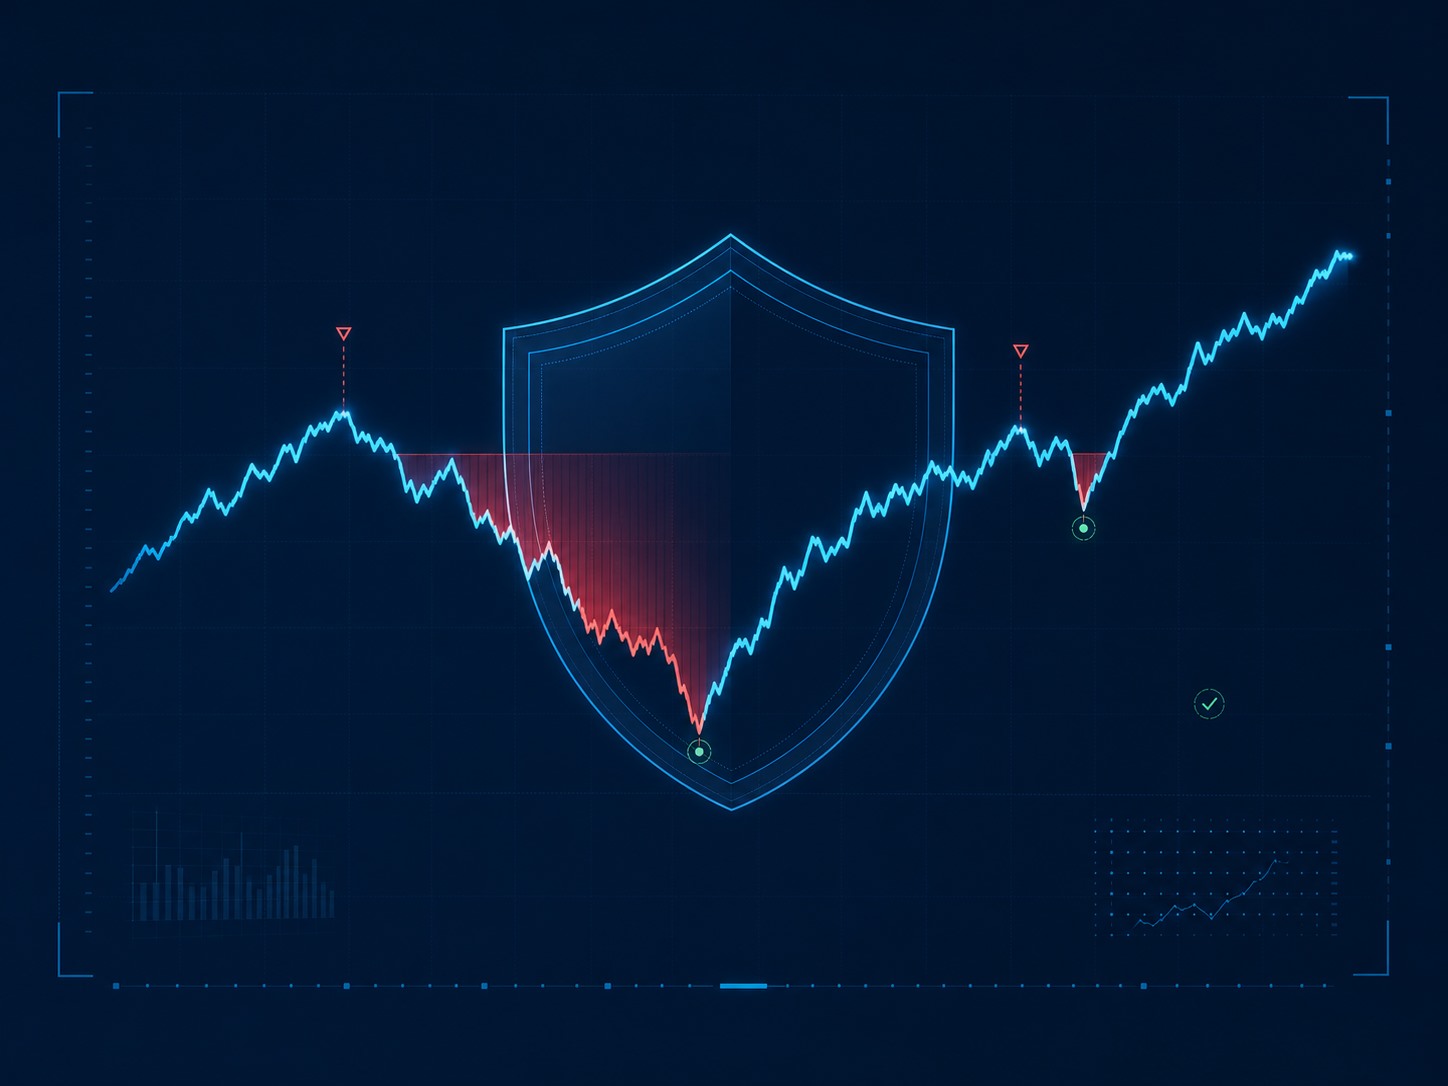
The high profit margin of the trading system does not in itself indicate its reliability. The strategy can show impressive returns, but go through periods of capital decline that the investor cannot sustain financially or psychologically. Therefore Maximum drawdown of trading strategy This is one of the basic risk indicators.
The maximum drawdown cannot be assessed separately from the context. The duration of the drawdown, the speed of capital recovery, the length of the historical testing of the strategy, the number of transactions, the quality of the data and the shape of the capital curve are important. The drawdown of a trading algorithm in real trading may be deeper than in the tester’s report.
What is a trade strategy drawdown?
The drawdown of a trading strategy is the reduction of capital from the previously reached maximum. It begins after the capital curve has formed a new peak, and ends only when capital has fully recovered that maximum. The current loss on a single trade and the drawdown of the entire strategy are not the same.
For example, capital rose from $100,000 to $120,000, then fell to $102,000. The depth of the drawdown was $18,000. The relative drawdown is 15% because the drop is measured from the previous high of $120,000, not the starting deposit.
Relative drawdown = (previous capital maximum − capital minimum) / previous capital maximum × 100%.
Types of drawdown: absolute, relative and maximum
Different types of subsidence answer different questions. The absolute drawdown shows how much capital fell below the initial deposit. If the initial capital was $100,000 and the minimum capital value was $92,000, the absolute drawdown is $8,000.
Relative drawdown measures the drop from the local maximum as a percentage. It is convenient for comparing accounts of different sizes, trading algorithms, portfolios and money management options. A algorithm with a drawdown of 15% can be compared to another algorithm in an account of a different size without counting into money.
The maximum drawdown is the largest recorded decrease in capital from the maximum to the subsequent minimum for the entire analyzed period. The maximum historical drawdown is not a guaranteed limit of future drawdown. In real trading, risk may increase due to a change in the market regime, slippage, spread widening, execution delays, differences in quotes, short test, or re-optimization of the trading system.
When reading the report, it is important to understand from which base the indicator is considered. Sometimes in the terminals nearby there is a drawdown on the balance, a drawdown on funds and a drawdown relative to the initial deposit. The balance includes only closed trades, and the account funds include open positions. If the algorithm holds losing trades for a long time, a drawdown can be much more dangerous than a calm drawdown on a closed balance sheet.
Another mistake is to compare the cash drawdown without taking into account the size of the account. Losing $5,000 in a $100,000 account and $20,000 account is a very different risk. Therefore, interest is usually used to compare systems, and the monetary value is left to plan capital and understand the actual amount that an investor should be willing to see in the negative.
Absolute.
Shows a fall below the starting capital. It is useful for assessing the initial risk of the account.
Relative
Measures the decrease from the local maximum in percentage. Convenient for comparing systems.
Maximum
Records the worst historical drop from peak to minimum in the selected period.
Depth of drawdown
The depth of the drawdown can be measured in terms of money, interest, risk units, the number of standard loss-making trades, or the relative average annual return. The same value can mean different trading system risk depending on expected returns and capital behavior.
For example, strategy A earns an average of 40% per year at a 15% drawdown, and strategy B earns 8% per year at the same 15% drawdown. Formally, the maximum drawdown is the same, but the ratio of return and risk in these systems differs. For the second strategy, recovery may take much longer relative to its normal growth rate.
A very smooth historical capital curve can also be a dangerous signal if it is obtained on a small number of transactions, after over-optimization, without commissions, without slippage, or on insufficient quality data. A too perfect line often requires the same scrutiny as sharp dips.
It is useful to compare the depth with the size of the position. The same strategy can have a drawdown of 8% for conservative volume and 32% for aggressive shoulder. In this case, it is not the trading logic that changes, but the management of capital. Therefore, when buying a trading algorithm, you need to look at what lot or what percentage of risk the test was conducted, and whether it is possible to reduce the volume without violating the logic of the strategy.
It is also worth studying the distribution of drawdowns. One single drawdown of 15% in ten years and regular drawdowns of 12-15% each year are different situations. In the first case, it can be a rare stress episode, in the second - the usual operating state of the system. It is not only the worst point that matters to the investor, but also how often the strategy causes them to experience similar periods.
Duration of drawdown
The duration of the drawdown is the period from the formation of the maximum of capital to the moment of the complete restoration of this maximum. It can be measured in calendar days, trading days, weeks, months, number of transactions or number of bars.
Imagine two strategies with a maximum drawdown of 12%. The first recovers in two months, the second is below the historical maximum of a year and a half. The depth is the same, but the psychological and financial risk for the investor is fundamentally different. In the second case, capital is in a state of uncertainty for a long time, and the algorithm owner can turn off the system at the worst possible time.
Sometimes the term “time under water” is used. In Russian, this is the period during which capital is below the previous maximum. For the practical evaluation of a trading algorithm, this indicator is often no less important than the depth of the drawdown itself.
Prolonged drawdowns are especially dangerous for investors who need to withdraw money regularly. If the capital is below the maximum for a year or two, withdrawals can perpetuate the loss and reduce the basis for recovery. Therefore, a strategy with a moderate depth but very long recovery time can be uncomfortable for an account where there are mandatory payments or planned capital withdrawals.
Duration also helps to distinguish normal stagnation from the breakdown of a trading idea. Any system strategy has periods when its logic is temporarily unsuitable. But if the current drawdown is already significantly higher than the historical time, you need to check whether the market has changed, whether the performance conditions have deteriorated and whether the algorithm has ceased to meet its initial hypothesis.
18–20%
7–10%
A few weeks or months
A year or longer
High burden on capital
High stress on patience and plan
Needs a margin in position size
We need to be prepared for long stagnation.
Capital recovery after drawdown
Capital recovery after a drawdown is nonlinear. If the account lost 10%, you need to earn not 10%, but 11.1% of the remaining capital to return. After losing 50%, half of the account remains, so you need to earn 100% to return to the original size.
Required profit for recovery = drawdown / (1 - drawdown).
In the formula drawdown is used in decimal form: 20% = 0.20.
5.3%
Falls are usually manageable.
11.1%
It takes discipline, but recovery is realistic.
25%
The error in position size is already noticeable.
42.9%
Recovery is becoming difficult.
66.7%
The risk of exiting the trading plan is high.
100%
We need to double the remaining capital.
150%
It's extremely difficult to come back.
233,3%
The risk of strategy collapse is critical.
400%
This is not acceptable to most investors.
That is why limiting the depth of drawdown is often more important than maximizing potential returns. The deeper the fall, the less freedom the strategy owner has.
The recovery of capital depends not only on the percentage of future profits, but also on time. If the strategy loses 30% and then recovers for three years, the investor actually gets a prolonged capital freeze. Formally, the score returned to the maximum, but during this period, alternative opportunities were missed, and the psychological load could lead to erroneous decisions.
Therefore, when evaluating a algorithm, it is useful to look not only at the final income for the entire period, but also at the recovery factor. In simple form, it shows how much profit the system received per unit of maximum drawdown. If returns are high just because the risk was excessive, such an outcome may be less attractive than a more relaxed strategy with moderate returns and a quick recovery.
A trade algorithm drawdown
When evaluating a trading algorithm, you can not focus only on the maximum drawdown from the report. It is necessary to check the length of the historical test, the number of transactions, the presence of different market regimes, the results on the site beyond optimization, the stability of parameters, step-by-step testing and the compliance of test transactions with real ones.
The drawdown of a trading algorithm in real trade may exceed the backtest. The reasons are familiar: the spread has widened, slippage has gotten worse, trading costs have risen, the sequence of trades has been less successful, and the market has moved into a mode that was almost not in the test.
Separately, you need to evaluate the open drawdown. Some algorithms show beautiful statistics of closed trades, but long hold losing positions. In a report, this may look neat if you analyze only the balance sheet. In reality, the investor sees the account funds, the margin load and the risk of forced closing of positions in a sharp market movement.
For a algorithm with a fixed stop loss, it is important to check how much the series of losing trades coincides with the historical drawdown. For grid and averaging systems, you need to additionally look at the maximum number of simultaneously open positions, the size of the volume in the series and the scenario of movement against the entire grid. A low drawdown on a short stretch of history does not automatically make such a model safe.
Drawdown of the portfolio of trading strategies
The maximum portfolio drawdown is not the simple sum of the maximum drawdowns of individual algorithms. It depends on the correlation of strategies, the coincidence of periods of loss, the allocation of capital, the amount of risk in each system, markets, instruments, the orientation of positions and the reaction to different market regimes.
Three strategies individually can have a drawdown of about 15%. If the periods of their losses do not coincide, the drawdown of the portfolio can be significantly lower. But if algorithms use a similar logic and lose on a single market move, diversification of trading strategies will be formal.
The different names of the instruments do not guarantee true diversification. Algorithms on the S&P 500, Nasdaq-100 and Dow Jones indexes can lose simultaneously during a general change in the US stock market regime. Therefore, it is necessary to evaluate not only the correlation of daily profits, but also the coincidence of the periods of drawdown.
It is especially useful for a portfolio to build an overall capital curve rather than looking at algorithm reports separately. If one algorithm is recovering and the other is in a drawdown, the overall result may be evener. But if all strategies respond to a single factor at the same time — for example, rising volatility, spread widening, or a sharp movement in indices — a portfolio drawdown can approach the worst-case scenario of multiple systems at once.
The distribution of capital also changes the picture. A formally small drawdown strategy can make a large contribution to overall risk if it is allocated the bulk of the account. Conversely, a more volatile strategy may be an acceptable part of a portfolio if its weight is limited and the periods of loss are not closely matched by other systems.
The Hidden Problems of Short Backtest
A short historical test often shows too low a maximum drawdown because different market regimes have not hit it. There might not have been a long side market, a crisis, a sharp increase in volatility, a change in liquidity, or a sufficient number of independent trades.
For example, a test over two years shows a maximum drawdown of 8%, and a longer test over 12 years shows several periods with a drawdown of 15-20%. This does not mean that the strategy has deteriorated. The short test simply did not contain enough adverse conditions.
It is important not only the calendar length of the test, but also the number of transactions, the number of independent market situations, the presence of trends, side movements, crises and periods of low volatility. If the parameters were tailored to a particular piece of history, the drawdown on the backtest may look much softer than future reality.
The short test also shows rare loss sequences poorly. Even if the average trade is positive, the order of transactions in the future may be less successful than in history. Several losing trades in a row at the beginning of real trading can create a drawdown that was not in the short report. Therefore, for a serious assessment, stress tests, random mixing of transactions and checking for deteriorating trading conditions are used.
It is also important to remember the change in liquidity. A strategy that traded well in a calm period may get a very different execution at the time of news or crisis. Capital drawdowns then increase not only because of strategy signals, but also because of spreads, slippage and the inability to reach the expected price.
- Check the number of transactions and trading years;
- find periods of trend, sideways and high volatility;
- take into account commissions, spreads and slippage;
- verify the independent data area;
- assess the stability of the parameters;
- Compare test and real transactions.
What kind of drawdown is permissible
There is no universal answer. The allowable drawdown depends on the investor’s goals, the investment period, psychological stability, the need to withdraw money, income stability, leverage, liquidity of instruments, the quality of testing, the number of strategies in the portfolio and the expected deterioration of results in the future.
A conditional classification may look like this, but it is not a universal investment standard.
Moderate.
It may be suitable for conservative models if the test is reliable.
Elevated.
Requires capital and discipline.
Tall.
A rigorous recovery assessment is needed.
Very high.
For many investors, the risk is unacceptable.
A 10% drawdown may be unacceptable for one model and normal for another. It is necessary to take into account the return, the duration of the drawdown, statistical reliability and the likelihood that the historical maximum will be exceeded in the future.
Tolerable drawdown should be determined before launch, not at the time of stress. If an investor decides in advance that a 15% reduction is the upper limit of working risk, he or she can prepare rules for reducing volume, temporarily halting strategy, auditing transactions, or reallocating capital between systems. If there is no such plan, the decision is often made emotionally and too late.
For algorithmic trading, it is especially important to separate the normal drawdown from the emergency one. The normal drawdown corresponds to the historical behavior of the strategy and is explained by the market phase. Emergency drawdown is accompanied by a violation of logic, execution errors, a sharp increase in volume, inconsistency of transactions with the backtest or exit for predetermined risk limits.
Permissible level of risk This is a drawdown in which the owner of the strategy is able to continue trading without violating the financial plan, emotionally shutting down the system and forced reduction of positions at the worst moment.
How to properly analyze the maximum drawdown
The evaluation of a trading algorithm should include not only the worst historical figure, but also the behavior of the system around it. It is important to understand how often drawdowns occurred, how long they lasted, how quickly capital recovered and as a result changed with the deterioration of trading conditions.
A good analysis begins with questions about data. At what time did the test take place? How many deals were included in the sample? Were commissions and slippage taken into account? Is the strategy beyond optimization tested? Is there a real time period or real statistics? Without these answers, the maximum drawdown remains a figure from the report, not a full-fledged risk assessment.
After that, you need to compare the drawdown with a personal or investment plan. If the strategy owner is not ready to survive a drop one and a half to two times deeper than the historical maximum, perhaps the position size is chosen too aggressively. Money management should leave a margin for future unfavorable conditions, rather than relying on a perfect repeat of the past.
- maximum depth of drawdown;
- average depth of drawdowns;
- the duration of the longest drawdown;
- average recovery time;
- Profit required to restore capital;
- the number of transactions in the test;
- length of the test period;
- Drawdown on an independent data site;
- results of stress testing;
- resistance to increased commissions and slippage;
- modeling of different sequences of transactions;
- matching drawdowns between portfolio strategies;
- a real drawdown after launch;
- Risk compliance with the financial plan.
Related material
For a more complete picture, it is useful to study these materials:
Conclusion
The maximum drawdown shows the deepest historical fall in capital, but by itself does not reveal the entire risk of the trading system. Absolute and relative drawdowns measure different risk characteristics, depth must be measured along with duration, and recovery from a major drop requires a disproportionately large return.
A short backtest often underestimates the real drawdown. The portfolio reduces risk only with true diversification, and the allowable level of drawdown should be determined in advance, before the strategy is launched. Managing drawdown is more important than trying to get the maximum return at any cost.
At Algo Trade Systems, drawdown assessment is built into the development and testing of algorithmic trading systems, from historical validation and stress scenarios to portfolio analysis. You can explore the available solutions on the page portfolios of trading algorithms or contact the team through contact.
The material is informational in nature and is not an individual investment recommendation. Past testing and trading results do not guarantee similar results in the future. Algorithmic trading involves the risk of financial loss.