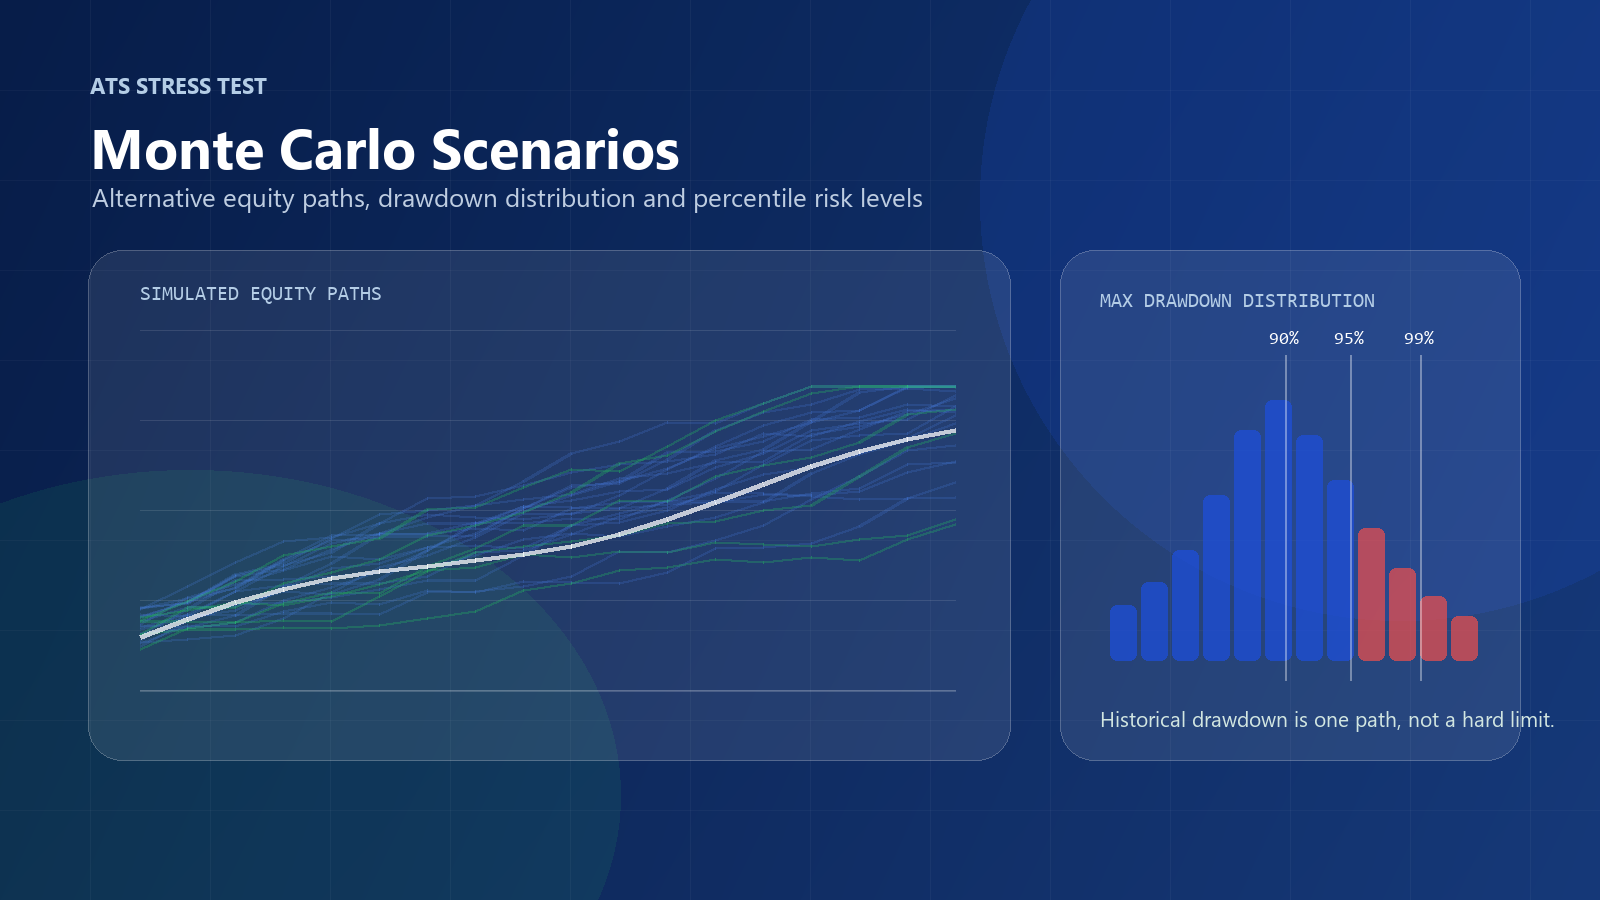
The standard backtest shows only one historical sequence of trades. The strategy could first make a few profitable trades, then go through a series of losses, catch a large profit and end the period with a recovery of capital. But the same or similar trades could have been different: a series of losses could have occurred immediately after launch, the largest losses could have been near, and recovery could have taken much longer.
Monte Carlo It is a method of repeatedly modeling random scenarios based on given rules and initial data. In the context Monte Carlo Trading Strategy It helps to see not one beautiful historical trajectory, but the distribution of possible options: profit, maximum drawdown, series of losses, duration of recovery and risk of critical loss of capital.
The Monte Carlo test does not predict the future. It shows how much the result can change with realistic deviations from the initial backtest. Therefore, it should be taken as an additional stress test of strategy, not as a guarantee of safety or profit.
What is the Monte Carlo Trading Strategy Test?
The Monte Carlo test is the repeated creation of alternative options for the trading system by randomly changing certain elements of the initial test. Depending on the chosen method, you can change the order of transactions, the results of individual transactions, the omission of part of the signals, the values of the parameters, the size of the spread, the commission, slippage, the time or price of entry, historical data and the sequence of returns.
Each individual scenario is called a simulation or scenario. After hundreds or thousands of scenarios, the trader receives not one figure, but a distribution of the results: the final profit, the maximum drawdown, the duration of the drawdown, the recovery ratio, the minimum capital, the number of losing transactions in a row and the probability of achieving a given level of losses.
The analysis is not a single best or worst simulation, but the whole distribution picture. The best scenario is often overly optimistic, the worst can be extreme, and practical value is usually given by the median, unfavorable percentiles, and comparison with the historical backtest.
Monte Carlo does not predict the exact future drawdown
It shows the distribution of results within the selected model. If the model is too simplified or the source data is poor, the distribution will be limited.
Why you need a stress test strategy
The main task of the Monte Carlo test is to test how much strategy depends on the successful historical order of events. The same set of trades can give a moderate drawdown in the initial backtest and a much harder start with a different sequence of profitable and unprofitable trades.
The second task is to assess the possible drawdown. The simulation helps to see how much the maximum drawdown in alternative scenarios may exceed historical significance. This is especially important if the initial report selects the risk on the trade or the size of the position.
The third task is to check the safety margin. You can worsen trading conditions: increase the spread, commission, slippage, shift the entry price or slightly change the parameters. If a slight deterioration in execution completely destroys the result, the sustainability of the trading system is questionable.
Monte Carlo helps you compare strategies. Two systems with the same historical returns may have different distributions of possible drawdowns and different recovery periods. But it is an additional stress test, not a replacement for quality. backtest of trading strategy, checks outside the sample and forward test.
Why One Backtest is Not Enough
Let’s say a historical test contains 500 trades, a net profit of $80,000, a maximum drawdown of 12%, and a Profit Factor of 1.55. Such a report is useful, but it only shows the outcome of one sequence of market events.
If several large loss-making trades are placed side by side, the maximum drawdown can increase, even if the trades themselves have not changed. Future trades can also be executed at different prices, get a larger slippage, occur at a different spread, skip due to technical errors, or change after a slight shift in parameters.
Monte Carlo does not test the accuracy of the historical record, but the sensitivity of strategy to uncertainty. This is especially important after optimization, when the result may be too well tailored to past data sequences. More about the risk of fitting is described in the article Re-optimization of trading strategy.
Random reshuffling of transactions
Shifting trades is one of the most understandable methods of the Monte Carlo trading algorithm. From the historical test, the results of all transactions are taken, the values of profit and loss themselves are stored, but their order changes randomly. Based on the new sequence, an alternative capital curve is constructed. The process is repeated hundreds or thousands of times.
Originally: +300, +200, -100, +500, -250, -150
Scenario: -250, -150, -100, +300, +200, +500
The set of transactions is the same, but the nature of the drawdown is different. The first sequence begins with capital growth, and the second with a series of losses. For an investor, these scenarios are psychologically and financially not equal, although the total amount for a fixed transaction size may coincide.
With a fixed cash amount of each trade, a simple reshuffle does not change the total amount of profit. It changes the shape of the capital curve, the maximum drawdown, the duration of recovery and the sequence of losses. If reinvestment is used and the size of the position depends on the current capital, changing the order of transactions can change the final result.
What the random order of transactions shows
The random order of transactions helps to estimate the possible maximum drawdown, series of losses, the duration of stay below the previous maximum, the minimum level of capital, the risk of an adverse start and the likelihood of achieving a given level of losses.
For example, the historical test showed a maximum drawdown of 10% and a maximum series of 6 losing trades. After 10,000 permutations, the median maximum drawdown can be 13%, the drawdown at a confidence level of 95% - 21%, at a level of 99% - 27%, and a series of losses at a level of 95% - 11 transactions.
This does not mean that the drawdown will necessarily reach 21% or not exceed 27%. This means that the historical drawdown may have been a good sequence and should not be used as a guaranteed limit for future losses.
Limitations of accidental permutation
A simple reshuffle suggests that historical transactions can be freely swapped. In reality, this is not always true: trades depend on the market regime, volatility often combines in periods, profitable and unprofitable trades form clusters, several positions can be opened simultaneously, and transactions on correlated instruments are related.
For portfolio systems, it is particularly important to maintain a link between simultaneous transactions. Correlating strategies cannot be independently mixed if this eliminates real periods of joint losses. Otherwise, the model will understate the portfolio risk.
More correct methods can rearrange daily returns, group trades, time blocks, entire trading days, or related portfolio results. The chosen method should be consistent with the structure of the strategy, not just easy to calculate.
Re-sampling transactions
Repeated sampling is different from normal permutation. In permutation, each historical transaction is used once, only the order changes. When re-sampling, trades are randomly selected from the original set: one trade may fall into the scenario several times, another may not fall at all, and the distribution of the final profit may also change.
Originally: +100, +200, -150, +300, -250
Sample: -250, -250, +100, +300, -150
This method creates more diverse scenarios, but still relies on historical trade distribution. It is not capable of automatically modeling a market event that did not exist in the original story. Therefore, the quality of the initial statistics remains critical.
Accidental omission of transactions
In real trading, some of the signals may be missed: communication failure, terminal delay, VPS failure, liquidity change, algorithm manual stop or broker restriction. The random skipping test checks how much the outcome depends on individual inputs.
If the strategy stays steady at missing 3-5% of random trades, that’s a good sign. If a few missed profitable trades completely destroy the final result, the system is too dependent on rare successful events. This conclusion is especially important for algorithms with a small number of transactions.
Changing the parameters of the trading algorithm
Modeling changes in strategy parameters checks the sensitivity of the system. For example, you can slightly change the indicator period, the level of the volatility filter, stop loss, take profit or entry time. The goal is to understand whether the logic of the strategy is kept close to the values selected.
If a small change in parameters sharply worsens the result, there is a risk of over-optimization. A stable trading system usually has not a single point with a perfect report, but an area of operating values. This is due to the notion of robustness of strategy: the outcome should not depend on overly accurate tuning.
It is important to set realistic ranges of random changes. Too wide a range can destroy even a sensible strategy, and too narrow will not show fragility. The check must comply with the logic of the market and the timeframe of the system.
Spread and slip check
Increases in spread, commission and slippage show a margin of trading advantage. If the average trade is small, even moderate performance deterioration can turn a profitable model into a weak or unprofitable one. Slippage modeling is therefore particularly important for intraday strategies and frequent algorithms.
Practical approach: increase the spread by a realistic amount, add random slippage, take into account the commission and compare the distribution of results. If a strategy maintains a positive expectation in most reasonable scenarios, it has a margin of safety. If the result is maintained only with perfect execution, the risk of trading algorithm is higher than it seems from the backtest.
Trading costs cannot be modeled arbitrarily. For futures, CFDs and different brokers are characterized by different commissions, spreads and liquidity regimes. A stress test must be based on realistic data, otherwise it will create either false calm or excessive pessimism.
What does a trust level mean?
The confidence level in the Monte Carlo report shows which part of the simulations was as good as the selected value within a particular model. For example, a drawdown at 95% means that in 95% of the simulated scenarios, the drawdown was equal to or less, and in 5% of the scenarios it was worse.
A 95% confidence level does not mean that the real result cannot be worse.
He's not a guarantee. The real market may go beyond the assumptions, and the model may not take into account events that were not in the historical data.
How to assess a possible drawdown
The assessment of a possible drawdown begins by comparing the historical drawdown with the Monte Carlo distribution. If the historical test scored 11 percent and the median simulation scored 15 percent, 95 percent scored 24 percent, and 99 percent scored 31 percent, then the initial report was a relatively mild scenario.
For risk planning, it is better to focus not on the historical maximum drawdown, but on unfavorable but realistic values. This helps you choose your position size so that a series of losses does not result in a critical loss of capital. More about the nature of the drawdown is in the article Maximum reduction of trading strategy.
It is important to consider the duration of recovery. Two strategies may have the same drawdown depth, but one recovers in two months and the other in a year and a half. For an investor, these are different risks, even if the bottom line is similar.
Monte Carlo for a portfolio of strategies
In a trading strategy portfolio, you can’t look at every algorithm in isolation. If multiple systems trade similar markets or respond to the same volatility regime, their losses may coincide over time. Independent mixing of trades can accidentally destroy this link and understate risk.
For portfolio analysis, it is better to model daily returns, groups of transactions, or related periods. This allows you to keep the correlation of trading strategies and see the risk of joint drawdowns. Diversification is only useful when strategies respond to the market in a truly different way, rather than just looking beautiful in individual reports.
A Monte Carlo portfolio helps to estimate the distribution of total drawdown, the likelihood of multiple systems deteriorating simultaneously, and the impact of position size on aggregate risk. This test is useful to combine with analysis. Diversification of portfolio strategies.
How to Use Monte Carlo to Select Risk Size
One of the practical results of modeling is adjustment of position size. If the initial backtest shows a drawdown of 11%, the trader may decide that the risk is selected comfortably. But if Monte Carlo shows a 95th percentile drawdown of 24% and a 99th percentile of 31%, the real capital stock should be planned differently.
It is better to choose the size of the risk not according to the average simulation, but according to an unfavorable but realistic scenario. If the investor is willing to endure a drawdown of up to 20% and the modeling shows 31% at the current position size, the risk of the trade may be overstated. A reduction in position size will reduce expected returns, but also reduce the likelihood of a critical scenario.
It is important to remember that reducing risk does not make a strategy profitable in itself. If the trading system has a weak or negative mathematical expectation, a decrease in position will only slow down losses. Therefore, Monte Carlo should be used after checking the quality of the backtest, the logic of strategy, costs and stability of parameters.
The practical procedure is as follows: first assess the distribution of drawdown and profit, then determine the maximum allowable loss of capital, then select the size of the position and again conduct a stress test. If, even with moderate risk, scenarios remain too heavy, it is better to refine or eliminate the strategy from the portfolio.
Probability of bankruptcy and critical level of capital
In the practical analysis of a trading algorithm, it is important not only to know the possible drawdown, but also to understand the probability of reaching a critical level of capital. For one investor, a reduction of 20% may be critical, for another – by 35%, for a portfolio manager – violation of the risk limit or margin requirements.
Monte Carlo allows you to calculate in what proportion of scenarios capital falls below a given level. For example, if the current position size of 7% of simulations shows a fall in capital by more than 30%, this does not mean that this probability is realized in the future. But it is a signal that the chosen risk may be too high for the stated limit.
The probability of ruin cannot be interpreted as an exact mathematical guarantee. It depends on the initial trades, the slippage model, the method of permutation, accounting for reinvestment, trading costs and assumptions about the future structure of the market. If there was no crisis period in the historical data, the model may underestimate tail risk.
Nevertheless, such a calculation is useful. It shifts the discussion of risk from sensation to scenarios: what happens if a series of losses begins immediately after launch, if the spread widens, if a few better trades are missed, if parameters shift slightly from optimal values.
Limitations of the Monte Carlo Method
Monte Carlo modeling does not make bad data good. If the initial backtest contains quotation errors, does not take into account commissions, uses an unrealistic spread, or is built on a re-optimized strategy, thousands of simulations will only create the appearance of deep verification.
The method also depends on assumptions. A simple reshuffle of trades suggests that past trades can be freely swapped. Re-sampling suggests that the historical distribution of trades describes future opportunities reasonably well. Slip modeling suggests that the chosen execution model is realistic. All of these assumptions may be untrue.
Another limitation is false accuracy. The 95th percentile of the 24.3 percentile is scientific, but it is not an absolute limit. The real market can create a scenario that has not been in any simulation. Therefore, the results are better rounded and perceived as a range of risk rather than an accurate prediction.
Monte Carlo is especially dangerous to use as an advertising filter: show only beautiful simulations, hide bad scenarios or choose a method that smooths the risk. Professional interpretation requires showing not only the median, but also unfavorable percentiles, duration of drawdown, series of losses and sensitivity to costs.
How to prepare the initial data for the test
Before launching Monte Carlo, you need to check the original report. It should have real commissions, spread, slippage, correct position size, understandable logic of inputs and outputs, a sufficient number of transactions and no obvious errors in the data. If the strategy is tested on ideal conditions, the stress test will be based on an overly optimistic basis.
The number of simulations should also be selected wisely. Hundreds of scenarios can give a rough picture, thousands can give a more stable picture of the distribution. The number 10,000 does not guarantee reliability. If the model misrepresents risk, increasing the number of simulations will only more accurately count the erroneous assumption.
It is important to fix in advance what elements change: only the order of transactions, the composition of transactions, the execution price, parameters or trading costs. If, after viewing the result, you change the settings of the test to get a beautiful picture, Monte Carlo turns into another tool for fitting.
Comparison of Monte Carlo Methods
Order.
Drawdown and series of losses
Composition and order
Profits and drawdowns
Algorithm settings
Sensitivity
Trading costs
Stock of benefits
Performance price
Sustainability
Part of the signals
Dependence on the best deals
Every method has a limitation. Permutation does not create new trades, re-sampling depends on history, changing parameters requires a reasonable range, and the slippage model may be unrealistic. Therefore, it is useful to use several methods and compare conclusions.
Practical example of trading algorithm analysis
Suppose the initial backtest of a trading algorithm contains 650 trades, a net profit of $92,000, a maximum drawdown of 11%, a Profit Factor of 1.62, an average trade of $142 and a maximum series of 7 losses. At first glance, the report looks neat.
650
Enough for the initial assessment
$92,000
The result of one trajectory
11%
Not the limit.
1,62
We need to check the stability.
Next, 10,000 simulations are performed: a permutation of the order of transactions, a random omission of 5% of transactions, an increase in the spread, an accidental slippage and a slight change in key parameters.
15%
24% / 31%
9
14 / 18
7 months
16/25 months
78 000
31 000 / 8 000
High values are unfavorable for drawdown, so the right part of the distribution is viewed: the 95th and 99th percentiles. For profit, low values are unfavorable, so the 5th and 1st percentiles are important. A historical drawdown of 11% looks more optimistic than most scenarios, and a small result in the extreme lower percentile shows a limited margin of safety.
Numbers are conditional and are not standards. The decision to launch depends on the risk tolerable, the quality of the backtest, the out-of-sample test, the forward test and how willing the investor is to survive the long recovery period.
Final checklist
- Are the initial deals enough?
- Are the historical data good?
- Are commissions, spread and slippage taken into account?
- Do you understand the type of Monte Carlo test?
- Does the order change or does the result change?
- Is reinvestment considered?
- Are there links between portfolio strategies?
- Are the ranges of random changes realistic?
- Are simulations enough?
- Have percentages of drawdowns been analyzed?
- Are the lower percentages of profits analyzed?
- Is the series of losses estimated?
- Is the duration of the drawdown estimated?
- Does the strategy withstand rising costs?
- Is the stability of the parameters maintained?
- Has the position size been adjusted?
- Have you passed an out-of-sample test and forward test?
Internal material on the topic
For a comprehensive verification of the trading system, it is useful to continue with these materials:
Conclusion
The standard backtest shows only one historical trajectory. The Monte Carlo test creates a variety of alternative scenarios and helps to estimate the range of possible gains, drawdowns, series of losses and the duration of recovery.
The random order of transactions shows how the shape of the capital curve changes. With a fixed transaction size, a simple reshuffle does not change the final profit, but changes the drawdown and psychological load. Repeated sampling, skipping transactions, changing parameters, spread growth and slippage can also change the final result.
The confidence level is not a guarantee of the maximum drawdown. Risk should be planned for adverse but realistic scenarios. Monte Carlo is not a substitute for off-sample testing, Walk-Forward analysis, and forward testing; its outcome depends on the quality of the input data and the assumptions selected.
A professional evaluation of a trading algorithm should include several independent sustainability checks, not just a beautiful historical record. It is the combination of backtesting, stress tests, portfolio analysis and real-world validation that gives a more mature basis for a risk decision.
The material is informational in nature and is not an individual investment recommendation. Backtest, Monte Carlo modeling and forward test results do not guarantee similar results in the future. Algorithmic trading involves the risk of financial loss.