Optimizing parameters is a normal part of developing a trading system. It helps to select working ranges, understand the sensitivity of the strategy, adapt the model to the characteristics of the market and eliminate clearly inefficient settings. Without optimization, the developer often does not know where the strategy is stable and where the result is held only by chance.
But there's a downside. re-optimization of trading strategy Turns the model into an accurate description of the past. The developer checks thousands of combinations, chooses the option with maximum profit and minimal drawdown, runs it on new data and sees a sharp deterioration. The reason may not be that the market has suddenly changed, but that the strategy has been tailored to historical buzz.
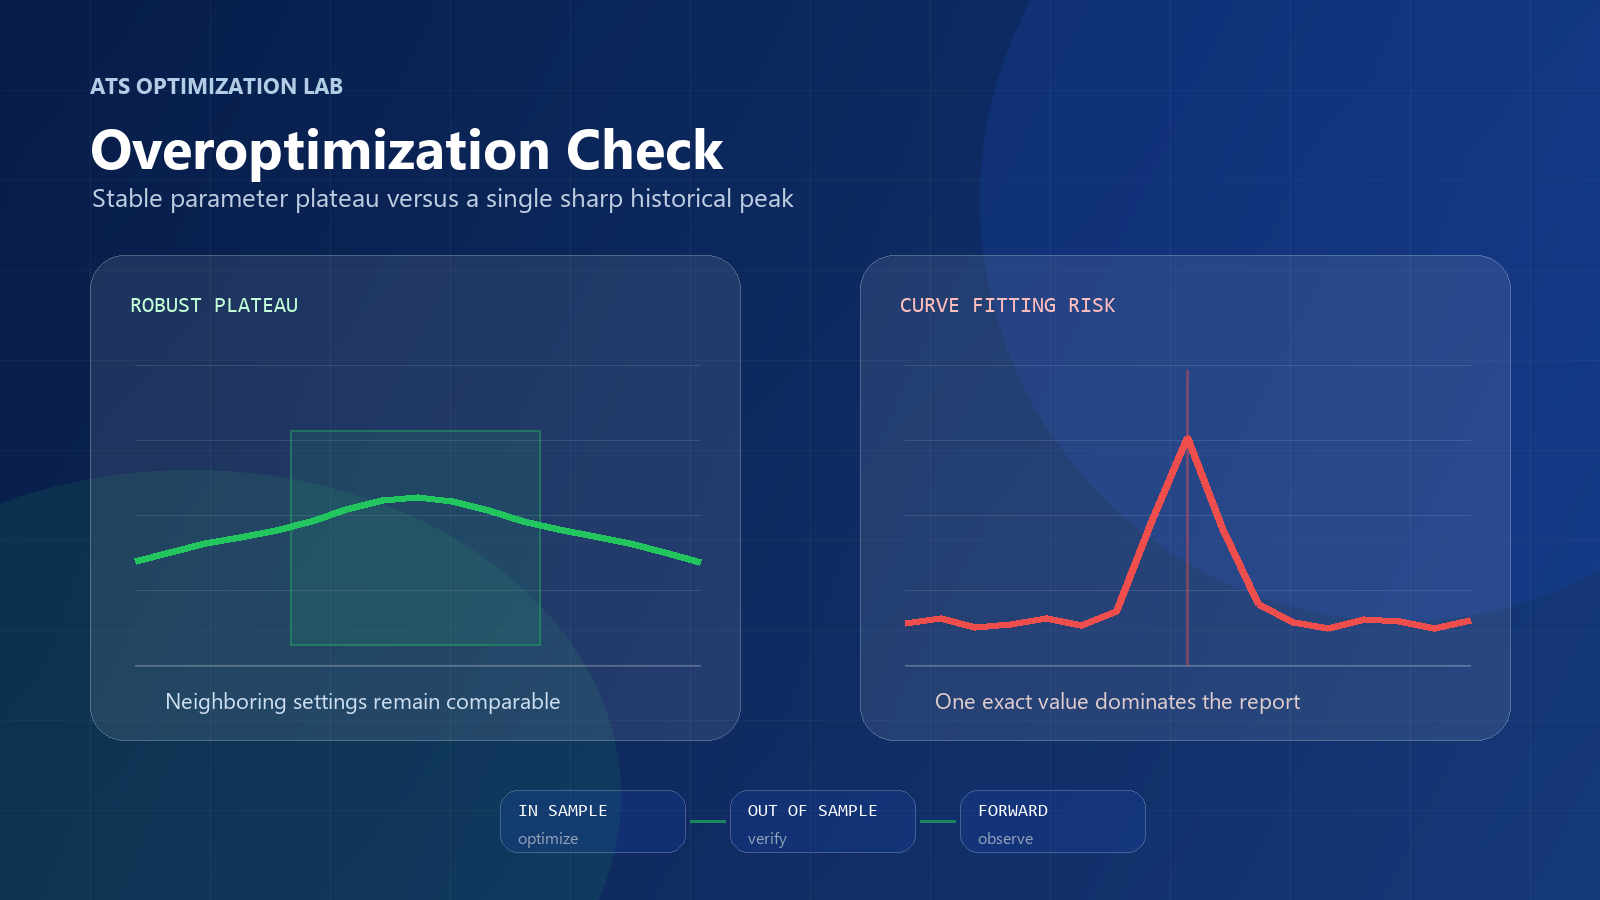
The goal of optimization is to find a stable area of operating parameters, not a single combination with the most beautiful backtest. A good historical result is useful only when it is confirmed by the stability of neighboring parameters, independent sampling, stress tests and real or forward trading.
What is the re-optimization of a trading strategy?
Over-optimization is a situation where the rules or parameters of a strategy are too precisely adjusted to the features of a particular historical site, including random market noise. On the capital chart, such a strategy may look convincing, but its advantage often disappears when new data emerges.
Normal optimization
In normal optimization, logically justified parameters are checked, wide ranges are used, neighboring values are analyzed, and the result is confirmed on independent data. The strategy retains key properties with small changes in settings.
Re-optimization
When you re-optimize, you choose one best result, the parameters are too accurate, a small change in setting destroys the indicators, and the strategy works only at the development site. On new data, the advantage is dramatically weakened or disappears.
The goal of optimization is to find a sustainable range, not the maximum historical profit.
If the indicator period from 18 to 26 gives comparable results, this looks more stable than one ideal period 23, next to which 22 and 24 sharply worsen the capital curve.
Why a beautiful backtest can be false
Historical testing shows how a strategy would work on known data under given rules. A false backtest occurs when a beautiful result appears not because of a stable pattern, but because of a random coincidence of rules with a past sequence of events.
There are many reasons: a large selection of options, the choice of the most successful period, the exclusion of unfavorable tools, fitting the entry time, accurate stop loss and take profit, the exclusion of bad months, insufficient accounting for commissions, unrealistic execution, errors in data, looking into the future or reusing the test site when refining the strategy.
The effect of multiple brute force is simple: if you test one random strategy, it will probably show mediocre results. If you look at a million random combinations, you almost inevitably find some very beautiful statistics. This does not prove that there is a market advantage.
High returns, a small drawdown and a flat capital curve are not proof of sustainability without additional checks. The more options are tested, the higher the chance of accidentally finding an attractive backtest.
Curve fitting and fitting to history
Curve fitting It is the adjustment of a model or strategy to specific historical data. In algorithmic trading, this means that rules actually remember the shape of a past price curve or the sequence of past events, rather than describing repeatable market logic.
A stable algorithm studies a general pattern: for example, that a certain type of momentum after compressing volatility has a statistical advantage. The re-optimized algorithm remembers the answers: specific clocks, filters, levels, and exceptions that coincided with the previous test.
Re-optimization is close in meaning to retraining the trading algorithm. At the same time, the signs of fitting appear not only with automatic optimization. The developer can manually change the entry rules, add filters, exclude individual trades, adjust the trading time and change the parameters after each bad section. If all these changes are taken after seeing the result, the risk of fitting increases.
How the number of parameters affects reliability
The more parameters are optimized, the more freedom the model has to adapt to the past. The indicator period, entry level, exit level, stop loss, take profit, trailing stop, trading time, days of the week, volatility filter, trend direction and maximum spread can be logical elements of the system. But each additional parameter increases the search space.
5 parameters x 10 values = 100,000 combinations
8 parameters x 10 values = 100,000,000 combinations
Among a huge number of combinations, it is easier to accidentally find a beautiful result. Each parameter should have a market explanation, and the number of parameters should correspond to the amount of data available and the number of transactions. The problem is not only the number, but also the freedom of choice: wide ranges, small pitch, a large number of filters and the ability to turn conditions on or off.
If the new parameter does not improve the stability of the strategy and does not make clear economic sense, it is better not to add it. A simple model with stable logic is often more reliable than a complex system that perfectly describes past history.
Hazards of accurate parameter values
Too precise settings can be a sign of a strategy fit: indicator 37 period, stop loss 1.73 ATR, entry only at 09:47, closing a position through 13 bars, a volatility filter of 0.0187 or a ban on trading in a few randomly selected months.
The exact value alone does not prove over-optimization. It becomes suspicious if neighboring values perform significantly worse, there is no market explanation, the parameter was selected only for maximum profit, and the result is not confirmed outside the sample.
The practical approach is to prefer stable ranges and simpler settings. If a strategy remains profitable with small changes in parameters, it is stronger than one sharp optimization peak that disappears with a minimal shift.
Why a short story is dangerous
A short historical period may not include trending phases, a long side market, crises, sharp increases in volatility, periods of low liquidity, changes in interest rates, changes in market structure, and unusual price gaps.
For example, the strategy is developed on two years of steady market growth and shows excellent returns. After the appearance of a sideways or falling market, the results deteriorate. The reason may be that the strategy has never been tested in other regimes.
It is important not only the calendar length of the history, but also the number of transactions, the variety of market regimes, the number of independent trading situations, the presence of crisis periods and the quality of data. A ten-year history of 40 trades is not always more reliable than three years with thousands of trades, but a large number of trades in one market mode does not provide universality.
Insufficient number of transactions
The fewer transactions, the more the final indicators depend on chance. One or two big trades can create a high Profit Factor, a few excluded losses can reverse the outcome, and a stable capital curve can be the result of a good sequence.
The number of transactions should be evaluated in the context of the type of strategy. For a rare long-term system, a few hundred trades can be a meaningful story, and for an intraday algorithm, that is often not enough. It’s important to look at whether trades are spread out over years and regimes, or whether almost the entire outcome is created in one short period.
A small sample is particularly dangerous when optimizing an algorithm. The fewer trades, the easier it is to randomly pick up parameters that beautifully describe past inputs and outputs, but do not provide a sustainable advantage on new data.
Why not choose the best outcome
Choosing the best optimization result for maximum net profit is one of the most common mistakes. Maximum returns often coincide with maximum fit: a strategy may have accidentally caught several large moves, exploited increased risk, or depended on a single market regime.
A more reliable approach is to look for a stable area. If dozens of neighboring combinations yield comparable results, moderate drawdown and positive mathematical expectation, such a zone is more interesting than one absolute maximum. It is better to choose parameters within a stable range, rather than at its extreme point.
One of the best historical reports
High probability of fitting
Group of similar results
More scrutiny and discipline of choice is needed
Behavior outside development
The period cannot be reused for improvement.
Stability of neighbouring parameters
Checking the neighboring parameters shows whether the result is part of a stable region or a single random maximum. In a sustainable area, a small change in settings does not destroy the outcome: profit, drawdown, Profit Factor and average trade remain comparable.
17,8%
13,4%
18,5%
12,9%
18,1%
14,2%
17,6%
13,8%
16,9%
14,6%
2,1%
34,0%
-4,8%
41,5%
31,2%
8,7%
1,4%
37,2%
-2,9%
39,1%
The second example looks suspicious: one parameter creates perfect statistics, and neighboring values deteriorate sharply. This is not definitive proof of fit, but a strong signal to test out-of-sample and stress testing strategies.
Out-of-sample strategy testing
An off-sample test is a test on data that was not used in the development and optimization of parameters. Its task is to show whether the logic of the strategy persists after going beyond the area where the parameters were selected.
Typical schema: Historical data is divided into a development site and an independent testing period. Optimization of parameters is carried out only in the first part. The selected rules are then recorded and checked in the second part without change.
Find working ranges
Choose one beautiful peak
Matching to a well-known history
False confidence
Check new data
Re-work for this period
Check future transactions
Drawing a conclusion too soon
If the parameters change again after the independent test, this period ceases to be completely independent.
Reusing an independent sample makes it part of the development. After several rounds of refinement, such a period can no longer be considered an honest test outside the sample.
Walk-Forward Analysis
Walk-Forward Analysis It is a step-by-step optimization, in which the strategy is optimized several times on one historical window and tested on the next, not yet used site. The window is then moved forward and the process is repeated.
This approach checks not only the set of parameters, but also the optimization process itself. If a strategy shows acceptable behavior at the next site each time, it is stronger than one successful test outside the sample.
The limitation of Walk-Forward analysis is that it does not rule out fitting entirely. You can pick up the length of the windows, the selection criteria and the set of parameters so that the final statistics will again become overly optimistic. So Walk-Forward is useful as a level of validation, not as definitive proof of sustainability.
Forward Test of Trade Algorithm
A forward test is a test of strategy on new data after a development is completed. Unlike conventional historical testing, future prices are not yet known at the time the rules are fixed. Therefore, the forward test is closer to real trading.
Forward can be conducted on a demo account, a small real account or in paper trading mode. It is important to fix the rules in advance: parameters, risk, tools, trading hours, filters and stopping criteria. If after each series of losses, the strategy changes, the forward test loses its meaning.
A good forward test doesn’t guarantee future returns, but it helps to see if the algorithm’s behavior matches the model. It is necessary to compare the frequency of transactions, the average trade, commission, slippage, drawdown and reaction to different market conditions.
Stress testing strategy after optimization
Stress testing helps to understand how the outcome depends on ideal conditions. If a strategy is profitable only with zero slippage, minimal spread, and precise execution, its sustainability is questionable. Real trading is almost always worse than the lab report: orders are executed with a delay, the spread expands, liquidity changes, and some transactions are opened not at the estimated price.
The first stress test is a decrease in trading costs. You can increase the commission, spread and slippage by a reasonable amount and see if the positive expectation is maintained. If a small increase in expenses completely destroys profits, the strategy is too sensitive to execution. This is especially important for intraday algorithms and systems with a small average deal.
The second stress test is changing the parameters. The stability of a trading strategy should be maintained not only at one point, but also near it. If a small change in the period of the indicator, stop loss or volatility filter abruptly breaks the result, this is a sign of high sensitivity. Such a strategy may look profitable in the report, but it is not good to tolerate natural market changes.
The third stress test is changing the sequence of transactions. Even if the same general statistics are maintained, another sequence of profitable and unprofitable trades can lead to a deeper drawdown. Therefore, it is useful to model a random order of transactions and evaluate not only the average scenario, but also unfavorable options. This does not prove future profit, but helps to understand the margin of safety.
Stress tests should not be used as a way to reset the ideal settings. Their task is the reverse: to deliberately worsen conditions and to check whether the strategy remains viable. If, after each stress test, the parameters are changed to restore a beautiful report, the process again turns into a fit.
Analysis of real and historical trade
Once an algorithm is launched, it is important to compare real trades to a historical model. Not only profit and drawdown are checked, but also the behavior of the system: the frequency of signals, the average duration of the position, the size of the average transaction, the distribution of profit and loss, the impact of commissions, slippage and deviation of the execution price from the estimated one.
If real trading is a bit different than backtesting, that’s fine. The historical model cannot perfectly reproduce future quotes, liquidity, and performance. But if the differences become systematic — trades get worse, average profits fall, losses rise, and drawdowns develop faster — you need to stop and understand the reason.
It is useful to keep a model compliance log: date, tool, signal, estimated price, actual price, commission, slippage, reason for exit and difference from backtest. Such a journal helps to separate normal market variability from signs that the strategy has been too closely tailored to past data.
Early conclusions on several transactions are dangerous, but technical irregularities should be noticed immediately. The algorithm should trade the rules that were fixed before the forward test: no hidden change in risk, random filters, and manual adjustments after each weak spot.
Signs of a re-optimized strategy
No sign proves fitting automatically. But the aggregate of signals should force the developer or investor to test the strategy deeper.
Limited and justified
A lot of settings
Comparable
Differ sharply
Wide plateau
Single sharp peak
Maintains positive expectations
The result is deteriorating dramatically.
Moderate.
Rising costs destroy profits
In general, it confirms the model
Strongly at odds with backtest
This is not a formal test, but a set of practical signs. The more features coincide, the more careful you need to be to start a strategy on a real account.
Common Mistakes When Optimizing an Algorithm
- Optimize all available parameters simultaneously.
- Taking too small a step.
- Choosing the maximum net profit.
- Ignoring the number of transactions.
- Lack of independent sampling.
- Re-use of the independent site.
- Avoiding bad years after seeing the results.
- Optimization for one broker without checking costs.
- Ignoring neighboring parameters.
- Lack of historical depth.
- No forward test.
- Change the strategy after each series of losses.
- Unrealistic position size.
- Valuing only the capital curve.
- Lack of fixation of development stages.
The common logic behind these mistakes is the same: the developer sees the result first, and then changes the rules to make the past look better. This is especially dangerous when buying a ready-made algorithm, where the investor sees only the final report but does not know how many options have been discarded.
Optimizing all parameters simultaneously It increases the number of combinations and makes it difficult to understand which element really affects the outcome. It’s best to test the basic idea first, then add parameters gradually and record what has changed.
Too small an optimization step It creates the illusion of accuracy. If a strategy is tested against hundreds of nearly identical values, the optimizer can easily find a random number that matches the past story better. For practical trading, a stable range is more important than an exact value before the second sign.
Choosing the maximum profit ignores risk, number of transactions, drawdown and stability. The maximum historical result is often at the edge of the parameter area, where a small change in conditions leads to a sharp deterioration.
Reuse of independent sampling Invisibly turns the test site into part of the development. If, after a failed out-of-sample test, the strategy is refined again based on that period, it is no longer fully independent.
Eliminating bad years After seeing the results, it is especially dangerous. Sometimes a weak period does involve a change in market structure, but the decision to remove it from the test should have a predefined logic, not a desire to improve the final capital curve.
Optimization for one broker It can give false confidence if the strategy is sensitive to spreads, commissions, swaps, or execution times. Before launching, it’s important to check whether the model can withstand real trading costs and market conditions.
Change of strategy after each series of losses It destroys statistics. Any trading system goes through unfavorable periods. If each drawdown is seen as an excuse to add a filter, the strategy quickly becomes a set of exceptions tailored to the past.
How to Optimize Your Algorithmy Algorithm
- Formulate a market idea.
- Create a basic version of the strategy.
- Determine the minimum set of parameters required.
- Set logical ranges and steps.
- Divide the data into a development site and an independent sample.
- Optimize only on the development site.
- Analyze areas of sustainability.
- Select parameters within a stable range.
- Set the rules.
- Conduct an out-of-sample test.
- Perform Walk-Forward analysis.
- Stress tests.
- Run a forward test.
- Compare the actual results with the model.
- Only after that, consider the launch with a working risk.
The goal of the process is not to create a perfect historical record, but to reduce the likelihood of random fitting. It is impossible to completely exclude the risk of over-optimization, but it can be significantly reduced by the discipline of development and multi-level verification.
Final checklist
- Do the rules have market logic?
- How many parameters are optimized?
- Is every parameter justified?
- Is the story long enough?
- Are there enough deals?
- Does the test include different market modes?
- Are the neighboring values stable?
- Is there a wide range of operating parameters?
- Are the results kept outside the sample?
- Was the independent sample reused?
- Has the Walk-Forward analysis been completed?
- Are commissions, spread and slippage taken into account?
- Does the strategy withstand the increased costs?
- Has the forward test been done?
- Does the profit depend on several transactions?
- Are the rules fixed before the final check?
Internal material on the topic
For a comprehensive sustainability assessment, it is useful to continue with these materials:
Conclusion
Optimization in itself is not a mistake. A mistake occurs when a strategy adjusts to the noise of a particular story and loses the ability to work on new data. A beautiful backtest can be the result of a large brute force of combinations, a short history, a small number of trades, or choosing the single best value.
Stable neighbor parameters are more important than a single maximum, non-sample verification should be carried out on data not used in the development, Walk-Forward analysis checks the repeatability of the optimization process, and forward test shows the behavior of the strategy on really new data.
For the investor and developer, it is not the most spectacular report that is important, but a reproducible verification process: fixed rules, clear logic, independent data, realistic trading costs, risk control and the willingness to abandon the strategy if it does not confirm its properties outside the development site.
Professional development of algorithmic systems requires multi-level sustainability testing, not just optimization of historical profits. It is impossible to completely eliminate the risk of fitting, but a disciplined process helps to avoid running a strategy that simply remembers the past well.
The material is informational in nature and is not an individual investment recommendation. Backtest, optimization and forward test results do not guarantee similar results in the future. Algorithmic trading involves the risk of financial loss.