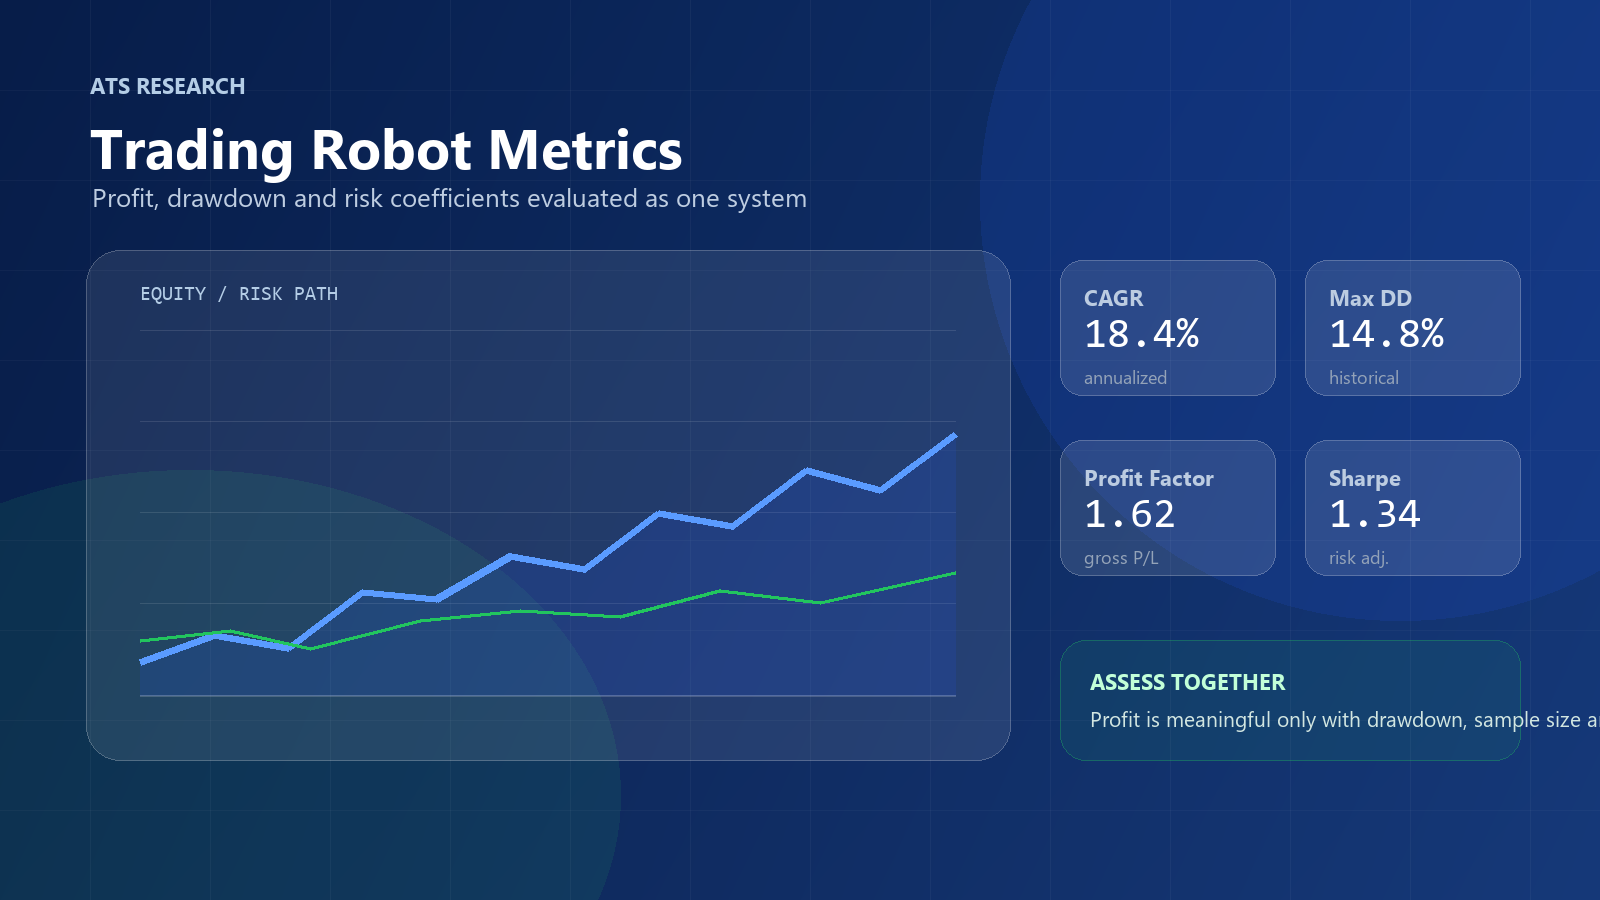
In the report of the trading algorithm, you can see dozens of numbers: profit, drawdown, Profit Factor, number of transactions, average transaction, percentage of profitable transactions, Sharpe ratio and other indicators. The problem is that a single figure without context is often misleading. High profits can be made at the expense of excessive risk, high percentage of profitable trades can hide rare large losses, and a beautiful Profit Factor can be calculated on only twenty trades.
So the question is not how to find the most impressive number, but how to find the most impressive. How to evaluate a trading algorithm comprehensively. The reliability of the strategy is determined by the combination of return, risk, statistical sufficiency, test quality and stability of results in different market conditions.
What indicators of trading strategy are important
Trading strategy indicators are only useful when they answer different questions. Profits show the bottom line, drawdowns show the way to that bottom line, risk ratios help compare returns with variability, and the number of trades shows how compelling the statistics are.
Final financial result
Doesn't show the risk.
Average annual complex returns
Doesn't account for drawdown.
Maximum historical decline
Could be exceeded.
Profit-loss ratio m
Depends on the sample.
Yield relative to total variability
Considers positive fluctuations as a risk
Yield relative to negative deviations
Depends on the calculation method
CAGR relative to drawdown
Depends on one maximum drop.
The average result of one transaction
Does not show the distribution of results
Share of profitable deals
Does not take into account the amount of profit and loss
You can not evaluate a trading algorithm on one indicator
One strong indicator can be the result of a successful period, over-optimization or increased risk. For professional assessment, return, drawdown, stability, realistic test and a sufficient number of transactions are needed.
Map of key metrics before deep analysis
Before you analyze the report in detail, it is useful to quickly divide the indicators of the trading algorithm by their role. This reduces the risk of replacing a comprehensive assessment with one beautiful figure. Each metric is responsible for only part of the picture: some indicators describe return, others - risk, and others - sample quality and sustainability of the result.
CAGR
It shows the average annual complex return. Suitable for comparing strategies with different lengths of history, but does not say how painful the path to outcome was. Therefore, CAGR should always be looked at alongside maximum drawdown and recovery duration.
Profit Factor
It shows the ratio of gross profit to gross loss. This is one of the basic indicators of a trading strategy, but it quickly loses meaning on a small sample or on a report where commissions, spreads and slippage are not taken into account.
Sharpe coefficient
Links return to the overall variability of results. It is useful for matching systems, but sensitive to calculation methods, data frequency, and rare extreme values. Comparisons should only be made between comparable reports.
Sortino coefficient
It focuses on adverse deviations and helps to separate unwanted volatility from positive fluctuations. But it depends on the chosen minimum yield level and does not replace drawdown analysis.
Squid coefficient
It shows how much the average annual yield is due to the historical maximum drawdown. It’s a handy metric for estimating the ratio of return to risk, but it depends on one of the worst parts of history.
Mathematical waiting
It shows the average expected result of one transaction according to historical statistics. It is especially important to compare it with the real trading costs: if the average trade is too small, the advantage may disappear in real execution.
Total profit of the trading algorithm
Total or net profit shows the financial result of the strategy for the entire analyzed period. In the correct report, it is calculated after deducting loss-making trades, commissions, spreads, swaps and other trading costs, if they are taken into account in the testing.
This indicator seems to be the main one, but in itself it is not informative. The return of a trading algorithm depends on the initial capital, test length, position size, leverage, capital management, number of transactions and the level of risk taken.
For example, algorithm A earned $100,000 in ten years, and algorithm B earned $80,000 in three years. Without knowledge of start-up capital, drawdown and position size, it is impossible to say that algorithm A is better. Perhaps algorithm B showed a higher average annual return with a smaller drawdown.
It is important to distinguish between cash returns, percentage returns, reinvestment-adjusted returns, and returns relative to risk taken. Total profit shows the final result, but does not show what risk it took to get it.
Average annual yield CAGR
CAGR This is the average annual compound return. It shows at what constant average annual rate capital would have to grow in order to reach the final result for the period under consideration.
CAGR = (final capital / initial capital)^(1 / number of years) - 1
If the initial capital was $100,000 and five years later rose to $180,000, the CAGR would be roughly 12.5% per year. This is more convenient than total profit because it allows you to compare strategies with different test lengths and takes into account the compound percentage.
But the CAGR does not show maximum drawdown, does not reflect capital fluctuations, and does not say how evenly profit is distributed. Two strategies with the same CAGR can have completely different risks: strategy A can show 20% per annum at a drawdown of 10%, and strategy B – the same 20% at a drawdown of 45%.
Maximum drawdown
The maximum drawdown is the deepest decrease in capital from the previously reached maximum to the subsequent minimum. It shows not just the loss, but the historical depth of the fall in the account during an unfavorable period.
Drawdown = (maximum capital - subsequent minimum) / maximum capital x 100%
Drawdown helps to assess the possible depth of capital decline, psychological load, necessary reserve, allowable position size and the risk of stopping trading at the worst possible moment. This is why analyzing a no-drain trading strategy is almost always incomplete.
The historical maximum drawdown is not a guaranteed limit for future losses. In real trading, it can be exceeded due to a change in the market regime, slippage, spread widening, performance deterioration, short test period, overoptimization or a random series of losing trades. This topic is detailed in the article Maximum reduction of trading strategy.
Profit Factor
Profit Factor This is the ratio of the total profit of profitable transactions to the total amount of losses. Under gross loss, the absolute positive value of all unprofitable transactions is usually used.
Profit Factor = gross profit / gross loss
If profitable trades brought in $150,000 and losing trades lost $100,000, Profit Factor is $1.5. A value below 1.0 means a loss-making strategy, about 1.0 - almost no advantage, 1.2-1.4 - a small margin, 1.5-2.0 - a potentially good result. Values well above 2.0 are attractive, but need to be carefully checked.
These ranges are indicative, not a universal standard. The Profit Factor does not take into account the length of the test, the depth of the drawdown, the sequence of trades and can be overstated in a small sample. Profit Factor 2.5 on 25 trades is less convincing than Profit Factor 1.6 on 1,000 trades and different market modes.
Sortino coefficient
The Sortino ratio is similar to the Sharpe coefficient, but focuses on negative deviations in returns. It tries to separate the usual positive fluctuations from the really unwanted volatility.
Sortino coefficient = (strategy yield - minimum acceptable return) / negative deviation
Negative deviation is the variability of only adverse outcomes that are below the selected minimum level. For trading strategies with rare large profits, the Sortino coefficient sometimes gives a more meaningful estimate than the Sharpe coefficient.
However, it depends on the chosen minimum level of return, calculation methodology and sample quality. A high Sortino ratio does not replace the analysis of the maximum drawdown and does not cancel the stability check of the trading strategy.
Squid coefficient
The squid coefficient links the average annual yield to the maximum drawdown. In classical practical application, it shows how many CAGR units are per unit of historical drawdown.
Squid coefficient = CAGR / maximum drawdown
If the CAGR is 20% and the maximum drawdown is 10%, the squid coefficient is 2.0. If the CAGR is the same 20%, but the drawdown is 40%, the squid coefficient is reduced to 0.5. For an investor, this is an important signal: the same return may require completely different risks.
The limitation of the squid coefficient is that it depends on one maximum historical drop. If the test is short or does not contain stressful periods, the score may look better than the strategy deserves.
Mathematical Expectation and the Average Deal
Mathematical expectation shows the average historical result of one trade, taking into account the probability of profit and loss. Simply put, this is the answer to the question of how much a strategy averaged to earn or lose per trade in the past test.
Mathematical expectation = (share of profitable trades x average profitable trade) - (share of losing trades x average loss trade)
If the strategy wins 55% of the time, the average profitable trade is $200, and the average losing trade is $150, the expectation will be positive. But if the trades are 80% profitable and the average loss is several times higher than the average profit, the final expectation may be weak or negative.
The average trade is useful for checking trading costs. If the average profit per trade is too small, commission, spread, and slippage can easily wipe out the advantage. Therefore, trading algorithm statistics should be evaluated with realistic costs, not just on the perfect backtest.
Percentage of profitable transactions
The percentage of profitable trades shows the proportion of trades closed at a profit. This indicator is easily perceived, so it is often used in advertising descriptions of trading systems. But a high percentage of profitable trades does not mean a safe strategy.
The strategy can close 85% of trades in the plus, but periodically receive large losses that cover most of the profits. Conversely, a trending strategy can have only 35-45% of profitable trades, but earn from large movements, where the average profitable trade is much higher than the average loss-making one.
The percentage of profitable trades should be analyzed together with the Profit Factor, average profit, average loss, mathematical expectation and drawdown. It describes the frequency of success, not the size of the consequences.
Number of transactions
The number of transactions affects the credibility of all coefficients. A small sample can randomly give a beautiful result: a high Profit Factor, a high Sharpe ratio, a low drawdown, and a stable capital curve. But that doesn’t necessarily mean the sustainability of the trading system.
There is no universal minimum number of transactions. For a long-term day-to-day strategy, 150-300 trades can be a meaningful story, and for an intraday system, this is often not enough. It is important to evaluate not only the number of transactions, but also their distribution by year, instrument, market regime and independent test sections.
If a strategy has made 40 trades in ten years, any metric will be sensitive to one or two big trades. If there are 1,000 transactions, but they all fall on one favorable market regime, the statistics can also be overestimated.
Stability of results for the year m
The stability of the trading strategy can be seen not only in the final profit, but also in the distribution of the result over time. A good backtest should show how the strategy has gone through different years: trending periods, side markets, volatility spikes, periods of low liquidity and abrupt changes in conditions.
If most of the gains were made in one year and the rest of the years are near zero or at a loss, the final CAGR may look stronger than the actual quality of the strategy. It is important to look at annual results, monthly drawdowns, the duration of the recovery and the shape of the capital curve.
A stable capital curve also requires caution. Sometimes it looks smooth due to averaging, martingale, hidden open loss or report features. Therefore, before the conclusions, you need to check the quality of the initial report: quotes, commissions, spread, slippage, swaps, the realistic size of the position, the lack of a look into the future and the presence of an independent test site. About the basic test test is described in more detail in the article Backtest of trading strategy.
Verification of the reliability of the report of the trading algorithm
Before interpreting the coefficients, you need to check the quality of the original report. Precise formulas have no practical value if they are calculated on an unreliable test. The backtest of a trading strategy may look professional, but it does not take into account real costs, use too short a period or rely on parameters selected for the past history.
The first unit of verification is data. You need to understand the source of quotes, the quality of historical data, timeframe, the presence of passes, the correctness of trading sessions and the correspondence of Bid and Ask prices. For algorithms that work inside the day, data quality is especially important: small errors in entry price, spread or execution can greatly change the final statistics of the trading algorithm.
The second block is trading costs. The report should consider commissions, spreads, swaps, slippage and realistic execution. If a strategy earns on average a few points per trade, even a slight deterioration in conditions can turn a profitable model into a weak or unprofitable one. Therefore, the average transaction and the expectation should be valued after the costs, not before them.
The third block is the independence of verification. It is desirable to see not only an optimized site, but also an independent test period, forward verification, stress tests, modeling of random order of transactions and comparison with real trading. If the strategy works well for only one specially selected period, the sustainability of the trading system remains in question.
- source and quality of quotations;
- accounting of commissions, spreads and swaps;
- Slip modeling;
- realistic position size;
- Lack of perspective on the future;
- the presence of an independent test site;
- the duration of the test and the number of transactions;
- results of stress testing;
- stability of parameters;
- Comparison of backtest with real trade.
How to compare two trading algorithms
Comparison of the two systems should take into account not only the return of the trading algorithm, but also the ratio of return and risk. Here is a conditional example: it does not announce the winner, but shows what questions to ask before choosing.
28%
18%
42%
14%
1,9
1,55
120
980
78%
52%
Tall but unstable
Moderate and more uniform
Algorithm A looks more attractive in terms of return and percentage of profitable trades, but has a deeper drawdown and a smaller sample. Algorithm B is modest in return, but shows more trades and more moderate risk. The final choice depends on the investor’s goals, the allowable drawdown and the quality of the initial test.
What indicators cannot be analyzed separately
High performance on short or optimized backtest may not be confirmed in real trading
- High returns without a drawdown analysis can mean inflated risk.
- A high Profit Factor without checking the number of trades can be a fluke.
- A high Sharpe coefficient cannot be compared with other reports without checking the calculation methodology.
- A high percentage of profitable trades without an average loss analysis can hide tail risk.
- A high CAGR without a maximum drawdown analysis does not show track quality.
- A stable capital curve excluding open loss may be an illusion.
Any indicator can be made attractive by choosing a convenient period, inflating risk, eliminating costs or over-optimizing. Therefore, the evaluation of a trading algorithm should begin with checking the reliability of the report.
Backtest and real trading: what to compare after launch
Even qualitative historical testing remains a model of the past. After launch, it is important to compare real trades with the logic of backtesting: do entry and exit points match, are the average trade size, slippage, retention duration, signal frequency and behavior during periods of increased volatility similar.
A slight difference between real trading and the test is normal. The market changes, execution is not perfect, and spread and liquidity depend on the time of day and the instrument. The problem arises when real results are systematically worse than the model: trades open later, losses rise faster, average profits decrease, and drawdowns develop deeper than the report suggested.
For a calm assessment, it is useful to keep a separate table of observations: the date of the transaction, the strategy signal, the entry price, the exit price, the commission, slippage, the reason for closing and the difference from the calculation model. Such a journal helps to understand whether the problem is in the trading logic itself, in the brokerage conditions, in the algorithm settings or in the fact that the initial backtest was too optimistic.
If real trading is short, you should not draw final conclusions on several transactions. But at an early stage, it is possible to check technical compliance: the algorithm must follow the rules as they are described, not change risk for no reason, not open excess positions and not violate capital restrictions. This is a practical part of the analysis, which is not replaced by any coefficient in the historical report.
It is a good practice to determine in advance which abnormalities are considered normal and which require stopping and rechecking. For example, an increase in average commissions can be taken as a market feature, but a sharp increase in drawdowns, a change in the frequency of transactions or a systematic deterioration in execution should be the reason for a separate analysis.
The final algorithm for assessing the trading algorithm
- Check the data quality. Make sure that the actual trading costs are taken into account and that a sufficient historical period is used.
- Estimate returns. Check total profit, percentage yield and CAGR.
- Risk assessment. Study the maximum drawdown, duration of drawdown and recovery of capital.
- Check the ratio of return and risk. Compare Sharpe, Sortino and Kalmar coefficients.
- Evaluate the quality of transactions. Check Profit Factor, Mathematical Expectation, Average Trade, Average Profit and Average Loss.
- Check the statistical sufficiency. Evaluate the number and independence of transactions.
- Check stability. Analyze the results by year, market regimes and individual instruments.
- Do a stress test. Check the resistance to increased costs, changes in parameters and other sequence of transactions.
- Compare the test with real trading. Check whether real transactions are consistent with the logic and results of the historical model.
Internal material on the topic
For a deeper examination of the trading system, it is useful to continue with these materials:
Conclusion
Total profit does not show the quality of the strategy, CAGR is convenient for comparing average annual returns, the maximum drawdown shows the historical depth of the fall in capital, Profit Factor characterizes the ratio of gross profit to gross loss, and Sharpe, Sortino and Kalmar coefficients help to estimate return relative to risk.
Mathematical expectation shows the average historical result of the transaction, the percentage of profitable transactions cannot be analyzed separately, and a small number of transactions reduces the credibility of any ratios. Year-to-year stability and the quality of an initial report are often more important than a single exceptionally profitable period.
Professional evaluation of a trading strategy requires comprehensive testing, stress tests, validation of real trading and portfolio analysis. Only a set of indicators provides the basis for an informed decision without promises of guaranteed return.
The material is informational in nature and is not an individual investment recommendation. Past testing and trading results do not guarantee similar results in the future. Algorithmic trading involves the risk of financial loss.