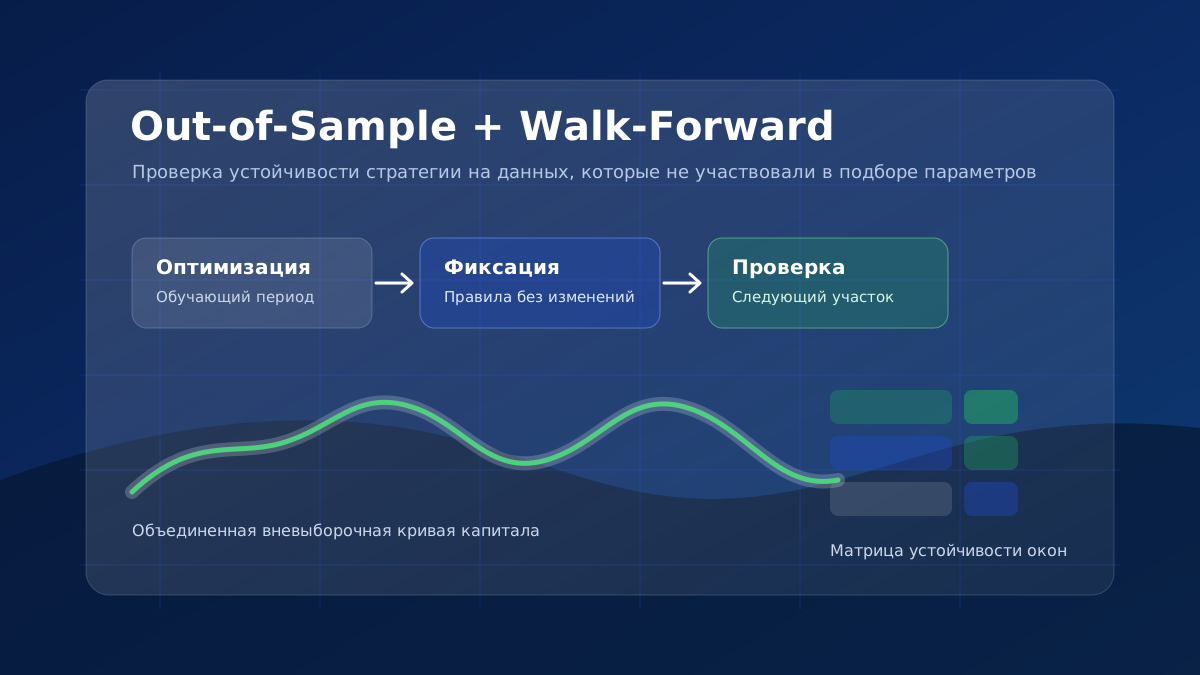
A beautiful backtest of a trading strategy does not prove that the system is sustainable. It only shows how strategy would behave in a known history under the chosen rules, parameters, and execution assumptions. If these rules were chosen after reviewing trades, drawdowns, and profitable plots, the result may not reflect a real market advantage, but an exact match of the model with past noise.
Out-of-sample verification It is necessary for another question: whether the logic of the strategy is preserved on data that was not used in the development. For example, the system was optimized for the period from 2015 to 2022, the developer chose a set of parameters with maximum profit, and then tested the same rules for 2023-2025. If in a new site, the average deal has disappeared, the drawdown has increased, and the capital curve has become chaotic, this could be a sign of fitting into the development site.
The more decisions are made after reviewing historical results, the less suitable this data is for independent verification of strategy. Therefore, the professional testing process is built in several levels: training period, test period, Walk-Forward analysis, stress tests, Monte Carlo and a real forward test on new data.
Why conventional backtesting is not enough
A conventional historical test is often used simultaneously to create an idea, select indicators, customize rules, optimize parameters, eliminate unsuccessful periods, and evaluate the system. In this process, the strategy is evaluated on the same data it was developed for. It’s like preparing for a textbook exam with known answers and then evaluating knowledge on the same questions.
A good result on the development site shows that the strategy describes a well-known story. But it does not answer the investor’s main question: will the logic hold when the market moves into a new mode, volatility changes, spreads widen, or a series of trades go in a different order? This requires an independent piece of data that was not involved in creating rules, selecting filters, and deciding whether to leave the strategy or delete it.
Key principle
The test period remains independent only as long as the result is not used to change the strategy.
Training and verification period
Training period This is a piece of historical data on which the logic of the strategy is created, optimization is performed, options are compared and the final configuration is selected. The term is not only used in machine learning. In algorithmic trading, this is also the term for the development of a conventional trading system with fixed rules.
Verification period It is an independent piece of data that is not used in setting parameters. It checks whether the positive mathematical expectation is maintained, whether the drawdown remains acceptable, whether the average trade disappears and whether the strategy behaves in the new conditions as suggested by trading logic.
Yes.
No.
Otherwise, verification loses its independence.
Yes.
No.
Parameters are recorded before the check.
Yes.
No.
You can't choose a strategy for the test site.
Development of a model
Independent evaluation
Test results are usually weaker and more realistic.
What is a strategy test outside the sample?
Out-of-Sample Data outside the sample that was not used to develop and optimize the strategy. Out-of-sample verification means the launch of an already formed and recorded trading system on such an independent stretch of history.
- Share the story. Prior to optimization, determine the training and testing areas.
- Only work with the training period. It builds an idea and selects parameters.
- Set the strategy. Rules, filters, risk and selection criteria should be closed to change.
- Run the test outside the sample. The test site is used once as an independent exam.
- Compare the results. What matters is not equality of profit, but the preservation of advantage and acceptable risk.
Out-of-sample testing reduces risk Re-optimization of trading strategybut does not eliminate it completely. A strategy can accidentally pass one test site well. Therefore, it is useful to check several consecutive sections through Walk-Forward analysis.
How to properly divide historical data
There is no universal proportion of training and testing. There are often 70/30, 60/40, or 80/20 benchmarks, but they are not the standard for all strategies. The choice depends on the total volume of history, the number of transactions, the timeframe, the type of strategy, the number of optimized parameters and the expected frequency of re-optimization.
For trading data, a chronological division is usually used: the early period for development, the next time period for verification. Random mixing of bars or trades between samples without taking into account the temporal structure can lead to the entry of information from the future into the training period.
The training period should contain a sufficient number of transactions, different volatility phases, trend movements, side sections and changes in the market regime. A window that is too short increases dependence on random events, and a window that is too long can mix outdated and modern conditions. The test period should be long enough to assess the drawdown and the average trade, but not so long that the process ceases to match the actual re-optimization rate.
How long should the training period be?
The length of the training window can not be selected only by calendar. For an intraday strategy, several months can give thousands of trades and several volatility regimes. For a long-term day system, even five years sometimes give too few independent trading situations. Therefore, not only years are important, but also the number of transactions, the distribution of results, the variety of market conditions and the number of parameters that need to be evaluated.
Too short a learning period often creates the illusion of accuracy. The parameters look convincing because they have described a small patch of history well, but any unusual series of trades can dramatically change the conclusion. Too long is not always better: the market may change structurally, liquidity may change, and old regimes may no longer have practical value. In this case, the strategy receives averaged parameters that no longer fit either the old or the current market.
How long should the verification period be?
The test period shall correspond to the period during which the selected parameters are intended to be used without re-optimization. If a strategy is actually re-optimized once a quarter, a multi-year test window may not describe the practical process well. If the strategy is designed for rare trades and long holdings, too short a quarterly test will not give a statistically meaningful picture.
At the test site, you need to get enough trades so that one profitable or losing position does not determine the entire withdrawal. The result is not required to repeat the training period. Normally, if outside the sample profit is lower, drawdown is higher, and trades are less even. The danger arises when the structure of the advantage disappears: the average transaction becomes less than costs, the drawdown goes beyond the risk plan, and the profit depends on one random episode.
What to Analyze During the Test Period
The verification of the trading strategy outside the sample should not be limited to net profit. Profits are easily skewed by one strong month or a rare trade. It is much more important to compare the quality of behavior in the training and testing periods.
- net profit and return;
- maximum and current drawdown;
- average transaction after commissions and spread;
- Profit Factor and the share of profitable transactions;
- number of transactions and series of losses;
- stability of parameters and logic of entrance;
- compliance of the result with the risk plan;
- The behavior of the strategy in new market modes.
If the out-of-sample profit is lower but the average trade remains positive, the drawdown is controlled and the logic of the trades is maintained, the result may be acceptable. If the profit is held on one episode and the rest of the story is unprofitable, the strategy requires additional verification, even if the final figure looks good.
The practical test begins with the question of what should be preserved. For a trending strategy, long waiting periods and rare large trades are permissible, but it is critical that it does not collapse in the side market. For the return model, the quality of the average transaction, control of a series of losses and resistance to spread expansion are more important. For the portfolio system, not only the indicators of individual strategies are significant, but also a joint drawdown.
It is also important to compare periods in the same way. If the training site is twice as long as the test site, you can not directly compare the absolute profit without normalization. It is better to look at the return for the period, the profit on the trade, the drawdown, the recovery after losses and the ratio of the result to risk. To evaluate a algorithm or strategy, it is useful to additionally compare the conclusions with the indicators from the article. How to evaluate a trading algorithm by indicators.
What is Walk-Forward Analysis?
Walk-Forward This is a consistent step-by-step optimization and verification of strategy in the following parts of the history. Instead of one data split, the process is repeated cyclically: the strategy is optimized on the training window, the parameters are fixed, then tested on the next verification window, after which the entire procedure is moved forward.
Selection of parameters in the training window.
Selecting rules without looking at the future site.
Launch for the next period unchanged.
Move to the next inspection cycle.
The practical meaning of Walk-Forward analysis is that it is closer to the actual operation of the strategy. The developer does not just choose one successful moment of the story division, but checks whether the advantage is maintained with several consecutive transfers of parameters to new data.
2016-2018
2019
Parameters selected for 2016-2018.
2017-2019
2020
A new set of parameters selected without 2020 data.
2018-2020
2021
The parameters after moving the window forward.
2019-2021
2022
Check the behavior in the next market mode.
In each cycle, the test period must be new in relation to the selected parameters. If a developer changes the optimization criteria for Cycle 2 after watching 2020, that year is no longer independent. Therefore, before the start of the Walk-Forward test, it is important to describe the rules: the length of the windows, the criterion for selecting parameters, the permissible drawdown restrictions, trading costs and the rules for rejecting the strategy.
Fixed and sliding window
In the Walk-Forward test, the training window can be built in different ways. Fixed window It maintains the beginning of history and gradually expands. This approach yields more data, but may be slower to respond to market changes. Sliding window Each time shifts the beginning and the end of the learning period. It better reflects fresh conditions, but may lose useful long-term statistics.
Fixed window
Train 1Test 1
Train 1+2Test 2
Train 1+2+3Test 3
Sliding window
Train 1Test 1
Train 2Test 2
Train 3Test 3
The choice depends on the nature of the strategy. For slow systems on daily data, a long history can be important. For intraday models sensitive to the microstructure of the market, too old data sometimes impairs adaptation. The main thing is to choose a method before analyzing the result, and not after fitting into a beautiful matrix.
A fastened window is convenient when an old story is assumed to retain information value. For example, a long-term strategy on liquid futures can use different crisis and calm regimes so that the parameters do not depend on one market. But if the instrument has changed trading hours, spreads, liquidity, or participants’ behavior, the old data can skew the valuation.
A sliding window is best suited when the model is to be closer to the current market structure. Its limitation is that old information is constantly removed from the sample. If there are few trades, parameters can become unstable and begin to react to random series. Therefore, the choice of a window should not be associated with the desire to get the best report, but with a real plan for the operation of the strategy.
How an extra-selective curve is constructed
Each Walk-Forward cycle provides a separate test site. To assess the sustainability of the trading strategy, these sections are combined into one non-selective capital curve. There are no deals from training windows because they were used to select parameters. This curve shows what would happen if the strategy were periodically re-optimized according to predetermined rules.
If the combined curve increases only by one cycle and the remaining periods are weak, the output should be cautious. A more reliable result is one where multiple independent test sites produce moderately consistent behavior without extreme dependence on a single market episode.
The combined extra-sample curve is particularly useful for drawing-down analysis. A single cycle may look acceptable, but when you connect several sites, you can see how long the strategy recovers from a series of losses and whether there is a recurring degradation after each re-optimization. This is closer to the experience of an investor who sees a continuous path of capital rather than a set of individual reports.
This curve should not be mixed with training areas. If you add optimization periods to the final graph, the result will be more beautiful, but it will lose meaning. The purpose of Walk-Forward is not to show the maximum historical profit, but to evaluate how fixed solutions worked after the transfer to the next site.
Efficiency of Walk-Forward
The effectiveness of Walk-Forward is often calculated as the ratio of the result of test sites to the result of training sites. For example, if the strategy on the training windows showed 100 units of profit, and on the test 55 units, the conditional efficiency is 55%. This is not a universal passing score, but a benchmark for comparing configurations and understanding the degradation of the result after transferring to new data.
Low performance can mean over-optimization, too short a window, a weak trading idea, or a strong change in market regime. Very high efficiency isn’t always good either: it sometimes comes from a short test site or one rare event. Therefore, the indicator should be considered together with the number of transactions, drawdown, average transaction and stability of neighboring configurations.
What results can be considered acceptable
The acceptability of the result depends on the task. For a conservative portfolio, a moderate drawdown, a stable average trade and a low dependence on one cycle are more important. For an early-stage research strategy, there may be enough signs of positive expectation if the risk of a launch is minimal and a real forward test is ahead. You cannot set a universal threshold for Walk-Forward performance that fits all markets, timeframes, and trading logics.
A good sign is the consistency of several indicators. For example, an out-of-sample curve does not have to be perfectly smooth, but it does not have to completely destroy the thesis of the strategy. Drawdown may be higher than training, but must remain within the predetermined risk. Profits may decline, but the average trade should keep a margin above commissions, spreads and slippages.
A bad sign is when the strategy passes only one criterion. For example, net profit is positive but achieved by one trade; Profit Factor looks high but deals are too few; drawdown is acceptable but trading has almost stopped; matrix shows one bright cell, but neighboring configurations fail. Such situations do not mean automatic failure, but require additional analysis.
Before making a decision, it is useful to write down the conclusion in the form of an investment thesis: why the strategy should work, what risk is considered normal, under what conditions the test is considered a failure, and what data is needed for the next stage. This document protects the process from emotional reassessment after one successful or unsuccessful period. If the criteria are not described in advance, any result can be explained retroactively, and this is no longer a study of stability, but a search for convenient interpretation.
What the Walk-Forward matrix shows
The Walk-Forward matrix compares different lengths of training and test windows. It helps to understand whether the result depends on one successful selection of periods or persists in a wide area of neighboring configurations.
Warning
One of the best cells in the Walk-Forward matrix can be the result of fitting. Look for a stable area of neighboring configurations.
42%
58%
51%
35%
54%
67%
63%
49%
50%
64%
61%
53%
31%
46%
57%
55%
In this conditional example, the most interesting is not the maximum value of 67%, but the area around 24-36 months of training and 6-9 months of verification. If neighboring cells produce similar results, the strategy is less sensitive to the exact window selection.
The matrix is useful only when it is used as a tool of stability, not as a new way of fitting. If a researcher runs dozens of window combinations and chooses the single best, they actually move the re-optimization to the level of the validation process. A more professional approach is to determine a reasonable window range in advance and then see if there is a wide range of acceptable results.
The economic meaning of windows must also be considered. The combination may look the best in the matrix, but it may not be suitable for real trading. For example, a strategy requires re-optimization every two weeks, but in reality, this mode is not possible due to operational constraints, commissions, implementation delays, or the risk of frequent parameter changes. In this case, the matrix shows an interesting historical result, but not a ready-made investment process.
How to choose parameters in each cycle
The parameters in each cycle should be selected according to a predetermined criterion. A bad approach is to take maximum profits. A more sustainable option is to look for a plateau: an area where neighboring parameter values produce a similar result with a limited drawdown and a sufficient number of trades. This reduces the likelihood that one randomly selected set.
It is also important to analyze the stability of the parameters between cycles. If optimal values jump from the minimum edge of the range to the maximum each time, the strategy may not have a stable structure. If the parameters change moderately and stay within a logically explicable range, this is better aligned with the idea of a sustainable trading system.
The selection criteria should be simple and repeatable. For example: select an area with positive returns, drawdowns below a predetermined level, a sufficient number of trades and close results of neighboring values. If the criteria change from cycle to cycle, the final Walk-Forward test becomes difficult to interpret. It is not clear what exactly was tested: the strategy or the ability of the researcher to find a new successful filter each time.
Separately, it is worth checking whether parameters are selected at the boundary of the range. If the optimum is consistently in the minimum or maximum value, the range may be incorrectly defined, or the model looks for extreme behavior instead of a stable area. Such a result requires an extension of the study, but the new range must already be tested on other independent material.
A real forward test of strategy
The historical Walk-Forward analysis is not a true forward test. Even if verification windows were not used in the selection of parameters inside the loop, the developer still sees the full historical base and can indirectly make decisions on past data. This forward test strategy is based on new data that was not available at the time of development.
In forward testing, it is important to compare not only profit, but also the coincidence of transactions with the model, the quality of execution, slippage, spread, commission, average transaction and drawdown development. A good Walk-Forward result can be grounds for a cautious start with minimal risk, but does not replace the observation of real trading.
A real forward test is especially important for strategies with a small average trade. In history, the model may take into account the conditional spread and commission, but real execution adds delays, partial executions, spread expansion in news periods, and differences between quote sources. If the average trade is small, even a slight performance impairment can change the mathematical expectation.
Forward launch is better to start with minimal risk. The task of the first stage is not to maximize profits, but to check the coincidence of real trading with the model: entry time, direction of transactions, position size, signal frequency, cost value and response to non-standard conditions. Only after a sufficient number of new transactions have been accumulated can a gradual increase in volume be discussed.
Walk-Forward Portfolio Analysis
For a portfolio of algorithmic strategies, not only each system is tested separately, but also the joint behavior. Two strategies can pass the test separately, but lose money in stressful modes. Therefore, portfolio analysis evaluates the correlation of returns, the coincidence of drawdowns, the allocation of capital and the contribution of each strategy to overall risk.
Walk-Forward Portfolio Analysis is useful to combine with Diversification of trading strategies, Monte Carlo tests test maximum drawdown. This set does not guarantee future profits, but it helps to see whether a portfolio depends on one instrument, one market mode or one successful period.
A Walk-Forward portfolio can show a problem that is not visible at the system level. For example, three strategies are tested outside the sample, but their loss periods coincide. At the reporting level of each strategy, risk appears acceptable, and at the portfolio level, there is a deep joint drawdown. Therefore, it is important to analyze not only the independent capital curves, but also the overall dynamics of capital after the weight distribution.
If portfolio weights are also optimized, they need to be tested using the same principles. You can’t pick up weights throughout history and then consider the portfolio result to be independent. Weight ratios, risk limits and policy exclusion rules should be fixed before the next site is checked.
Comparison of verification methods
Conformity with the strategy of the known history.
Fitting past data.
The initial evaluation of an idea.
Transfer of fixed rules to a new site.
Accidentally a good point of separation.
Independent test after development.
Several successive cycles of optimization and verification.
Select the best matrix after seeing the result.
Evaluation of re-optimization regulations.
Behavior on new data and real performance.
Short observation period or small volume of transactions.
Final confirmation before increasing risk.
Typical errors
- Sharing the story after seeing the results.
- Reconfigure the strategy for the test site.
- There is too short a test period and not enough deals.
- Choosing a successful division of history.
- Analysis of only net profit without drawdown and average trade.
- Choosing the best matrix cell without neighboring configurations.
- Constant change of the optimization criterion.
- Walk-Forward is not a real trading process.
- Ignoring commissions, spread and slippage.
- Using data from the future.
- Ignoring the stability of the parameters.
- Substituting this forward test with historical analysis.
Most errors come down to one thing: verification ceases to be independent when the result begins to influence the rules. If a developer adds a filter, changes the period, eliminates a tool, or chooses a different metric after a failed test, a new independent verification cycle must be started.
Another common mistake is to compare different methods as if they answer the same question. Backtest shows the correspondence of a known story. Out-of-sample testing shows the transfer of a fixed strategy to one new site. Walk-Forward analysis evaluates the repetitive re-optimization process. The forward test checks behavior on data that was not available at the time of development. If you mix these roles, it is easy to get a confident but incorrect conclusion.
It is also dangerous to ignore the trade costs. A strategy can successfully pass the Walk-Forward matrix before commission accounting and slippage, but lose advantage after a realistic execution model. This is especially true for frequent intraday systems, scalping models and algorithms with a small average deal. In such cases, verification should include a worsened condition, not just an optimistic baseline scenario.
Finally, one good result cannot be considered proof of the stability of a trading algorithm. Sustainability is a set of features: logical idea, sufficient sample of transactions, preservation of the average transaction, controlled drawdown, stable parameters, reasonable matrix, stress tests and confirmation on new data. Each individual test can be wrong, so the methods must complement each other.
How to use Walk-Forward with Monte Carlo
Walk-Forward analysis answers the question of whether the strategy is maintained when the parameters are transferred to the following historical sites. Monte Carlo answers another question: how sensitive is the result to random order of trades, deterioration of execution, missing part of signals or changing trading conditions. These methods do not replace each other.
The practical process may look like this: first, the strategy passes the out-of-sample test and several Walk-Forward cycles, then a combined out-of-sample curve and trade list are used for stress tests. If Monte Carlo shows that a slight deterioration in the spread or a change in the order of trades leads to an unacceptable drawdown, the strategy requires a more cautious risk plan, even if the underlying Walk-Forward report looks positive.
It is important not to adjust the Monte Carlo parameters after seeing the result. If you first increase the allowable slippage, then reduce it, change the rules for eliminating transactions and choose the most convenient scenario, the stress test turns into another level of optimization. It is better to determine in advance a set of stresses: a change in the order of transactions, an increase in costs, the skip of profitable transactions, a deterioration in the average price and checking for longer series of losses.
Complete algorithm for strategy verification
- Formulate a trading idea. The rules must have clear market logic.
- Prepare the data. Check quotes, commissions, spread and execution model.
- Identify periods. Divide the story to optimization.
- Set the selection criteria. For example, a stable plateau with a drawdown restriction.
- Optimize on the training site. Do not use verification data.
- Perform the test outside the sample. Do not change the rules after the result.
- Do a Walk-Forward analysis. Use several consecutive cycles.
- Build a matrix. Check the adjacent window lengths.
- Evaluate parameters. Find stable ranges, not a single point.
- Consolidate the inspection sites. Build an extra-selective capital curve.
- Stress tests. Take into account Monte Carlo, worsened costs and drawdown.
- Run a real forward test. Use new data and minimize risk.
Final checklist
- The data is separated until optimization.
- The test site was not used in the development.
- In the training and verification periods, there are enough transactions.
- History includes different market regimes.
- The rules and criteria for the selection of parameters are fixed.
- Outside the sample, positive expectations remain.
- The average transaction exceeds the trading costs.
- The drawdown fits the risk plan.
- There are several Walk-Forward cycles.
- A combined extra-selective curve has been constructed.
- Profit does not depend on one cycle.
- The matrix shows a stable area of adjacent windows.
- Parameters are stable between cycles.
- Commissions, spread and slippage are taken into account.
- A real forward test was carried out before the risk increased.
- The method did not change after seeing the results.
Submissions on the topic
Conclusion
The training period is used for development and optimization, and the verification period should remain independent. A good result on the development site does not prove the stability of the trading strategy, and reconfiguring the test site destroys its value as an independent test.
Walk-Forward analysis extends validation: it repeats optimization and testing on multiple consecutive windows, helps build a combined extra-sample curve, and evaluates resistance to period length selection. But it is not a guarantee of future returns and does not replace a real forward strategy test with new data.
The main value of this approach is the discipline of research. It forces you to separate the data in advance, fix the criteria and distinguish the test of a hypothesis from the selection of a convenient report. For the investor, this is more important than a beautiful metric because the process shows how prepared the strategy is for unknown conditions.
Professional development of a trading system requires consistent multi-level verification: fixed rules, independent data, parameter analysis, stress tests, Monte Carlo, drawdown control and cautious forward start. The purpose of this process is not to choose the most beautiful historical curve, but to understand whether the strategy has a reproducible advantage and manageable risk.