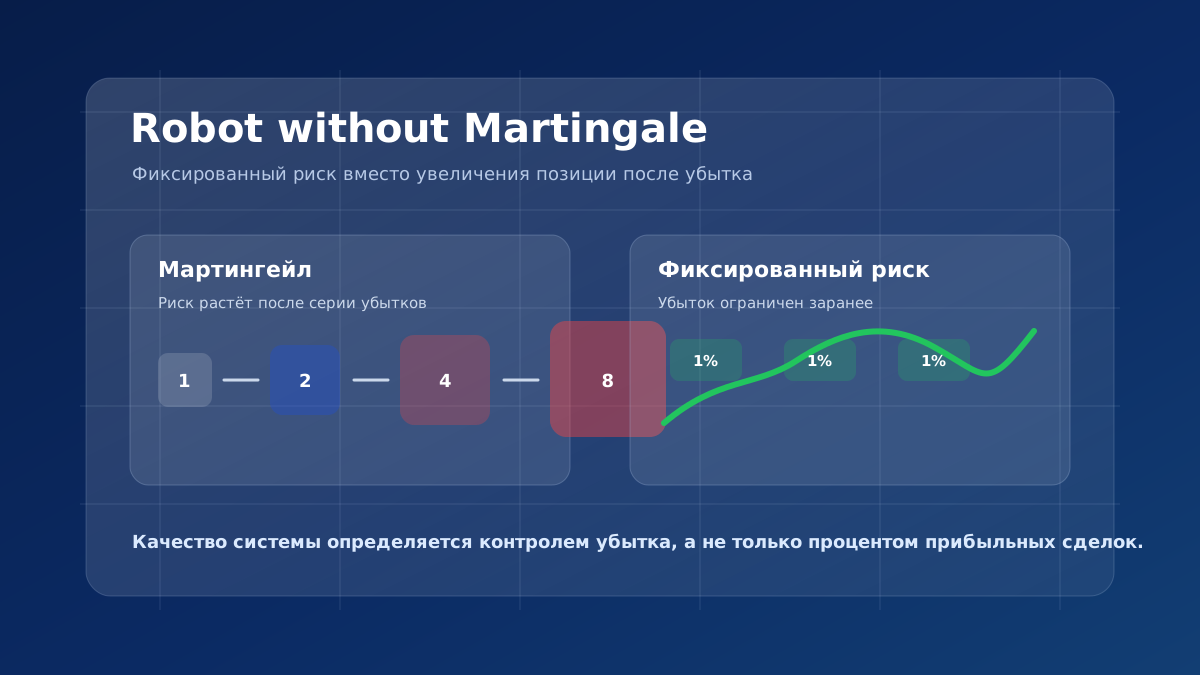
Buyers of algorithms are often looking for trading algorithm without martingaleBecause they understand the main risk of such systems: a sharp increase in the lot after a series of losses. The algorithm can close small profitable trades for many months, show 80-95% accuracy, and look stable until the market passes a strong recoilless movement. At this point, increased positions can create a drawdown that wipes out profits over a long period.
The concern is not just with the word "martingale" itself. The investor is concerned about the accumulation of several unprofitable positions, dependence on the size of the deposit and leverage, opaque real drawdown and the likelihood of losing a large part of the account for one market movement. The balance curve may look flat as long as open positions create a deep floating loss on the account.
The quality of a trading system is determined not by how often it wins, but by how much control the loss remains when the market moves against it. The absence of a martingale and a grid does not make the trading algorithm risk-free, but it does make the risk more transparent: loss should be limited in advance, and not carried over to increasingly large positions.
What is a martingale in a trading algorithm
Martingale in a trading algorithm is a method of managing the volume of a position in which after a loss the size of the next trade or additional position increases in an attempt to recover the previous loss and complete the series with an overall positive result. In the classical scheme, the position size is doubled, but real algorithms often use softer coefficients: 1.2, 1.5, 1.7 or dynamic increase depending on the drawdown.
Even if the lot is not doubled, but by 20-50%, the principle of recovery of loss by increasing risk remains a kind of martingale. After several consecutive increases, the load increases faster than it seems in one step. An increase of 1.5 after six unprofitable steps gives an increase of more than 11 times compared to the initial volume.
The main problem is that the theoretical scheme assumes the possibility of continuing the increase almost indefinitely. The real account is limited by deposit, margin, leverage, maximum volume, liquidity and broker rules. When a series is longer than expected, the algorithm is faced not with a mathematical abstraction but with a lack of capital.
It is important not to reduce the analysis to one question: “Is there a doubling or not?” Some algorithms increase the volume smoothly, use a coefficient of less than two, add positions only after a certain distance, or change the lot depending on the current drawdown. In the report, such a model may look softer than the classic doubling, but the principle remains the same: the worse the series develops, the more capital is put on its restoration.
That is why we need to look not at the name of the method, but at the behavior of the position. If, after a loss or price movement against an entry, the total volume rises and the closing of the series depends on a subsequent pullback, the strategy transfers the risk to the future. This approach may look stable for a long time, but its stability is determined by the most unfavorable site, not the usual calm days.
How martingale differs from grid and average
Martingale, grid and averaging are related but not the same. Martingale It describes the increase in volume after a loss. Grid. means placing several orders at specified price intervals. Averaging Adding a new position in the same direction after the price moves against the first position to change the average entry price of the group.
An algorithm without a grid and a algorithm without a martingale are not exactly the same. The algorithm may not use a martingale, but open a grid of identical positions. He may not use the net but raise the lot after each closed loss. A multi-position option is also possible, where the total risk of the entire group is preliminarily limited.
Not necessarily.
Yes.
A rapid increase in the next loss.
Yes.
No.
Accumulation of common ground.
Yes.
Not necessarily.
Increased open loss.
Yes.
Yes.
Simultaneous increase in volume and drawdown.
Maybe.
Not after the loss.
A series of pre-limited losses.
The most dangerous is usually the combination of averaging and increasing volume. In this case, the algorithm adds positions against the movement of the market, increases the total lot and counts on a rollback. If the pullback is not long, the loss increases simultaneously due to the distance of the price and the size of the accumulated position.
A grid with the same lot is not automatically safe. Even without increasing volume, it can accumulate a large aggregate position. For example, ten orders of 0.1 lots give a total volume of 1 lot. If they are all open in the same direction and the market continues to go against the basket, the risk becomes a portfolio risk rather than a single trade risk.
Therefore, when analyzing an algorithm, it is important to ask two different questions. The first is whether the volume increases after the loss. The second is whether the total risk of all open positions is limited. A algorithm may formally be without a martingale, but remain dangerous unless it limits the number of orders, the total lot, the maximum floating loss, or the retention time of a losing basket.
The main risks of martingale
The risks of martingale are not that each such system immediately loses count. A lot of algorithms can really work in a quiet market for a long time. The problem is asymmetry: a series of small gains is bought by the possibility of a rare but large loss.
- Exponential growth of position. Even a moderate increase in the lot quickly creates a large load.
- Limited capital. Deposit, margin and broker limits do not allow you to increase the volume indefinitely.
- Long series of losses. The future series may be longer than the maximum series in history.
- Changing market regime. What worked in the sidewall can break in a strong trend.
- Increased marginal load. New positions reduce free margins and increase the risk of forced closure.
- Slip and spread. In sharp movements, losses can be more calculated.
It's important.
Martingale does not eliminate the loss. It moves it to a larger position.
Why a high percentage of profitable trades is dangerous
The percentage of profitable transactions cannot be analyzed separately. The strategy can have 95 profitable trades at $10 and 5 losing trades at $250. The total profit will be $ 950, the total loss - $ 1,250, the total - minus $ 300. At first glance, 95% accuracy looks impressive, but the mathematical expectation is negative.
Martingale and grid systems often create a flat balance curve because most baskets close with little profit. But the balance only takes into account closed transactions. Account funds also take into account the current open result. If the algorithm holds a large loss-making basket, the balance can remain beautiful, and the funds show a deep floating loss.
Therefore, when evaluating the algorithm, you need to look at the average profitable and unprofitable transaction, the maximum loss, open floating loss, the history of the lot change, the maximum number of simultaneously open orders and drawdown It is the account, not just the balance.
What does a algorithm without a martingale mean?
A algorithm without a martingale doesn’t increase risk just because the previous trade was a loss, doesn’t necessarily try to recover a past loss with the next position, and doesn’t require an infinite deposit increase to continue the series. Such an algorithm calculates the volume according to a predetermined risk model and limits the loss to a stop loss, group limit or other formal rule.
However, the size of the position can still change. It is not a martingale if the change is related to capital size, distance to stop loss, instrument volatility, point value or a single percentage of risk. For example, with a short stop loss, the algorithm can open a larger volume, and with a wide stop loss, a smaller one. The monetary risk in both cases remains approximately the same.
Warning
The absence of martingale does not make a trading algorithm risk-free.
Fixed risk on the deal
Fixed risk on the deal Each new entry risks a predetermined share of current capital. For example, the capital is $10,000, the risk is 1%, which means the maximum allowable loss of the transaction is about $100. If the stop loss is further away, the position volume decreases. If the stop loss is closer, the volume may increase, but the monetary risk remains limited.
Position formula
Position size = allowable monetary risk/risk per 1 lot to stop loss
- Capital: $10,000.
- Risk on the deal: 1%, or $100.
- Potential loss of 1 lot to stop loss: $250.
- Estimated volume: 100 / 250 = 0.4 lots.
In real trading, the calculation should take into account the specification of the instrument: the value of the item, the size of the contract, the minimum pitch of the lot, the currency of the account, commissions, spread and possible slippage. Stop-loss usually limits a loss, but in gaps or sharp movements, the actual strike price may differ from the estimated price.
A fixed percentage of risk is particularly useful during a drawdown. If capital falls from $10,000 to $8,000, the 1% risk decreases from $100 to $80. The system automatically reduces the money load when the account is in an unfavorable phase. Martingale works the opposite way: after a loss, it increases volume and makes the next mistake more expensive.
But fixed risk should not become a formality. If a algorithm opens several simultaneous trades, it is necessary to consider not only the risk of each position, but also the total risk. Five trades of 1% can yield 5% open risk if they are dependent on a single market factor. For a portfolio of strategies, this is especially important: the same currency, instrument, or direction can create a hidden concentration.
Fixed lot and fixed risk
Fixed lot and fixed risk are different models. A fixed lot means that the algorithm opens the same volume regardless of the distance to the stop loss. If a stop loss is short, then a wide, monetary risk can vary greatly. Fixed risk, on the contrary, adjusts the volume so that the potential loss remains close to the specified value.
A fixed lot may be acceptable for simple tests or very stable instruments, but for a professional risk assessment, it is more important to understand a monetary loss in an adverse scenario. If one trade risks 0.5% of capital and the other 4% just because of a farther stop, the strategy can have an unpredictable drawdown profile.
Can a trading algorithm be safe?
The phrase “safe trading algorithm” should be used carefully. There are no absolutely safe trading systems. Any algorithmic strategy faces market risk, data errors, execution, market mode change, and technical failures. A algorithm without a martingale may be more transparent about risk, but it can still lose money.
A more correct formulation is a trading algorithm with limited and measurable risk. Such a algorithm determines the maximum loss of a position in advance, limits the total risk of open trades, takes into account trading costs, undergoes independent verification and does not promise a guaranteed recovery after any series of losses.
If the word “safe” is used in the algorithm’s description as a promise of no risk, that’s an excuse to stop and ask for details. A more professional description should talk about specific restrictions: maximum risk on the trade, maximum number of positions, limit of daily or weekly drawdown, stop-loss model, stop-trade rules and tests on worsened conditions.
Security in the investment sense does not mean the absence of losses. It means that losses should not become uncontrollable and unexpected for the owner of the capital. If the potential loss is not measured in advance, the investor actually accepts the risk, the amount of which will only be known at the time of stress.
How to check an algorithm without a grid
A trading algorithm should start with a full report, not with marketing statistics. It is necessary to request the history of transactions, the schedule of funds, the maximum open loss, the maximum number of simultaneously opened positions, real commissions, spread, results on a long history and independent data. A detailed general approach is described in the article How to check a trading algorithm before buying.
- Check the lot change. Volume should not rise as a reaction to a previous loss.
- Check open positions. It is necessary to understand whether a grid, averaging or a basket is used.
- Find a loss limit. The stop loss or group limit must be measurable.
- Compare balance and funds. A large gap between them often indicates a hidden load.
- Check for stability. Use an out-of-sample test, Walk-Forward, and Monte Carlo.
If the algorithm is declared as a algorithm without a grid, check how many positions can be opened simultaneously on one tool. Sometimes the grid is hidden behind the names "series of inputs", "position scaling" or "adding by signal". The mere presence of multiple inputs is not a problem if each entry has its own risk and total limit. The problem arises when additional trades are opened only because the first position has gone into the red.
It is also important to check the test for a long history. Grid logic can go well with frequent kickbacks and deteriorate dramatically in a trending market. Therefore, the report should include different phases: calm sideways, strong directional movements, periods of spread expansion, news, low liquidity and recovery after a drawdown.
What indicators of the trading algorithm to analyze
It is not only the return that needs to be assessed. Maximum drawdown, drawdown, average trade, mathematical expectation, Profit Factor, ratio of average profit to average loss, number of transactions, maximum series of losses, size of the largest position and sensitivity to trading costs are important. One high percentage of profitable trades does not prove quality.
For a algorithm without a martingale, it is especially important that each loss is understandable in size. If the report cannot assess the risk per trade, the total risk of a group of positions, and the worst-case scenario, the strategy remains opaque. Compare the results with the methods of the materials evaluation of the trading algorithm by indicators, re-optimization and Out-of-sample testing and Walk-Forward analysis.
Particular attention should be paid to the average transaction after costs. If the algorithm earns a few points on average, and the spread and slip can change by a comparable amount, even a system without a martingale becomes sensitive to performance quality. In this case, you need to test the worsened conditions, not just the ideal backtest model.
Another indicator is the probability of ruin or the risk of achieving a critical drawdown. It depends not only on the percentage of profitable trades, but also on the average loss, position size, series of losses and selected risk per trade. The higher the risk in each position, the fewer adverse events are needed to substantially damage capital.
Comparison of Martingale and Fixed Risk
Martingale
After a loss, the risk of the next position increases: 1 -> 2 -> 4 -> 8.
Load rises in drawdownFixed percentage
After capital decreases, money risk also decreases.
Load decreases in drawdownIncrease in volume
Preservation or reduction of risk
Fixed risk is easier to control.
It's going to rise dramatically.
Limited by the position model
It is important to consider the series of losses.
Often looks flat to a major failure
More honestly reflects losses
You need to look at the balance and the means.
They can grow fast.
Pre-measurable
Risk is easier to build into a portfolio.
Reverse martingale
A reverse martingale is a model in which volume increases not after a loss, but after a profit. The idea seems more logical: the strategy increases the load when capital rises, and reduces it after losses. This approach is closer to trend money management, but it does not equal fixed risk and requires caution.
The potential benefit of reverse martingale is that the risk does not increase during drawdown. However, the profitable series can end just when the volume has already increased. If the increase rules are too aggressive, the system becomes sensitive to the order of trades: one losing position after a series of wins can take a significant part of the accumulated profit.
Therefore, the reverse martingale should be analyzed as a separate dynamic model of money management. It is important to understand when volume increases, how quickly it decreases after a loss, whether there is an upper limit to risk, and how the model passes Monte Carlo tests with the changed order of trades.
Typical advertising traps
Advertising descriptions often highlight pleasant metrics and hide the risk structure. Wordings like “95% of profitable trades”, “less than 5% drawdown”, “a algorithm always closes a basket in a plus”, “intelligent recovery system”, “safe grid”, “stop loss is not necessary” or “loss is only temporary” do not necessarily mean cheating. But each of them requires additional questions.
You need to request a full report, a schedule of account funds, volume history, maximum open loss, maximum number of positions, results with commissions and spreads, a test on an independent site and monitoring real trade. If the seller shows only the balance, the percentage of profitable trades and the final return, it is impossible to assess the risk of the trading algorithm.
Particularly cautious is the phrase “a large deposit is recommended for sustainability.” Sometimes this is a normal requirement for the margin and volatility of the instrument. But sometimes it means that a strategy must survive a long series of averaging. In this case, a large deposit does not eliminate the risk, but only postpones the moment when the series becomes critical.
Portfolio instead of recovering losses
Attempting to recover a loss by increasing volume concentrates risk in one logic. A more professional path is a portfolio of independent strategies where different systems run on different tools, timeframes and market modes. In this approach, capital recovery does not depend on the fact that one loss-making position must necessarily close in a plus.
The portfolio does not eliminate risk, but allows it to be distributed. It is important to analyze the correlation of strategies, the overlap of drawdowns and the total capital limit. This logic is explained in the article about Diversification of the portfolio of trading strategies.
How to Choose a Algorithm Without Martingale
- Check the trading logic. Understand what pattern the algorithm makes a profit.
- Check the lot change. Make sure that the volume does not increase due to the previous loss.
- Check the grid and average. Find all simultaneously open positions and their overall risk.
- Check the loss limit. Find a stop loss or other measurable limit.
- Check the funds curve. Not limited to the balance schedule.
- Evaluate the numbers. Watch yield, drawdown, average trade and mathematical expectation.
- Check for stability. Use the independent test, Walk-Forward, Monte Carlo and worse costs.
- Run a forward test. Run the algorithm on a demo account or with a minimum volume.
Final checklist
- Does the lot increase after the loss?
- Are there any additional positions against the movement?
- Whether the overall take profit basket is used.
- The number of orders and the total volume are limited.
- Is there a stop loss or a measurable risk limit?
- Is the total open risk known?
- Check the account curve.
- How different is it from the balance curve?
- What is the maximum historical drawdown?
- What is the expected drawdown in Monte Carlo?
- Does the profit depend on rare restorations?
- Was the test passed outside the sample?
- Have you done a Walk-Forward analysis?
- Has the forward test been done?
- The total risk of the portfolio is taken into account.
Submissions on the topic
Conclusion
Martingale increases the trading load after a loss. Grid, averaging, and martingale are related but different mechanisms, and the fastest-growing risk usually occurs when averaging and increased volume are combined. A high percentage of profitable trades does not prove a security if a rare loss is able to cover a long series of small profits.
A algorithm without a martingale does not attempt to recover a loss by increasing the next risk. With a fixed percentage of risk, the cash load usually decreases during a drawdown because the position size is calculated from current capital and distance to stop loss. But the lack of martingale does not guarantee return and does not make the algorithm completely safe.
A professional algorithmic system should be based on measurable trading advantage, limited risk, verification of the funds curve, stress tests, independent validation and portfolio approach. What is important for the investor is not the smoothest historical line, but a clear mechanism for controlling losses that remains workable when the market goes against the strategy.