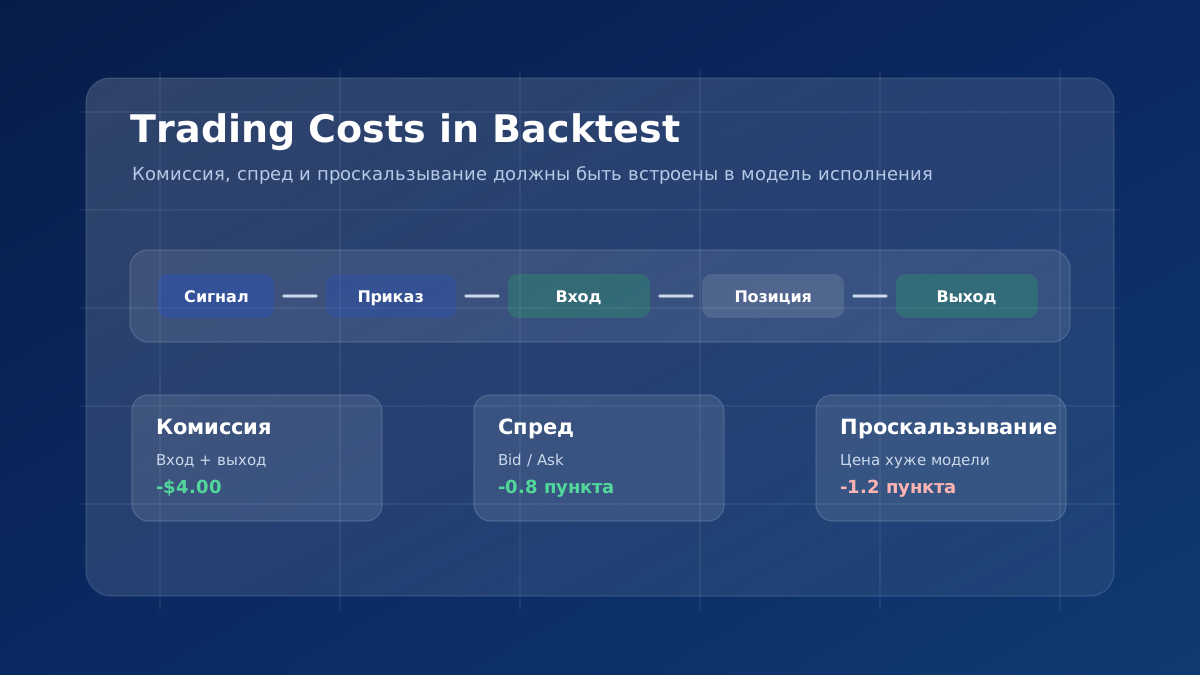
One of the common reasons, Why backtesting is different from real tradingIt is not a breakdown of trading logic, but a faulty cost model. In the tester, the strategy can show attractive profits, but after starting on a real account, the return decreases, the average transaction decreases, the drawdown increases, some signals are executed at a worse price, and some limit orders are not executed at all.
The difference arises due to commission, spread, slippage, execution delay, liquidity, the way orders are modeled, quote differences, swaps, position transfer fees and other costs. A backtest without realistic trading costs shows the potential logic of inputs and outputs, but does not confirm that this profit can be obtained after real execution.
A professional trading algorithm test should answer a simple question: does the strategy retain an advantage after accounting for realistic commissions, spreads, and slippage? If profits disappear after a small increase in costs, the historical result does not have a sufficient margin of safety.
What is included in trading costs
Trading costs All costs and losses that occur when opening, holding and closing a position. Part of the costs are visible in the report as a separate line, and part is hidden inside the execution price. The commission can be written off explicitly, the spread is included in the difference between the purchase and sale price, and slippage manifests itself as a difference between the expected price and the actual price.
Paying a broker or a stock exchange.
Separate write-off.
Unit: party, cycle, warrant, contract.
The difference between the purchase and sale price.
Included in the entry and exit price.
A fixed or historical spread.
Price changes before execution.
The actual price is worse than expected.
Model for different orders.
Position shift or loan.
Periodic accrual or write-off.
Retention days and direction of position.
Execution of an exchange contract.
Separate fee.
Exchange rate, clearing, regulatory fees.
A typical mistake is to consider only commission and forget that the strategy pays for spreads, worst executions, swaps, currency conversions, partial executions, and delays in order delivery. For frequent strategies, every little thing accumulates in a significant amount.
It is useful to divide the costs into explicit and implicit. Explicit costs are easy to see in the report: brokerage fee, exchange fee, clearing, swap or position transfer fee. Implicit costs are more complicated: the deal opened 0.4 points worse, the limit order was not executed, the stop worked when the spread widened, and part of the position closed at a less favorable price. If the tester only considers explicit costs, the result may look better than the actual trade.
Another mistake is to think of the costs as permanent. In quiet hours, the strategy can work almost like a model, but during the release of statistics, the opening of the session, low night liquidity or strong movement, the costs change dramatically. Therefore, a quality backtest should reflect not only average conditions, but also periods where performance becomes worse.
How to consider the commission in the backtest
Commission in backtest It should be deducted from the result of each transaction in accordance with the real rates of the broker, exchange and platform. The commission model can be a fixed amount per transaction, a contract amount, an amount per lot, a percentage of turnover, a percentage of nominal value, a minimum commission, or a multi-level tariff depending on the volume.
The same number in different tester settings can mean different things. The commission may be applied for entry, exit, full entry-exit cycle, order, for each actual execution, contract or for the entire scope of the position. You cannot transfer the value from the broker’s report to the tester without checking the unit of measurement and the time of application.
For futures, the commission is often set on the contract rather than the entire trade. If the strategy trades five contracts, the costs are multiplied by five. For CFDs and currency instruments, the commission can be set per lot, a million turnover or a percentage of the nominal value. For shares, there is a commission per share and a minimum amount per order. In cryptocurrencies, the tariff may depend on whether there was an order maker or taker, that is, added liquidity or took it out of the glass.
Before running a series of tests, it is useful to manually check one trade. Open the report, take a specific entry and exit, calculate the broker’s tariff fee and compare it to what the tester wrote off. If the calculation does not match on one trade, the entire backtest will be distorted. Such a test is boring, but it often finds errors that change the conclusion about strategy.
Check the tester model.
The commission can be applied separately at the entrance and exit. Before setting up, check the model of a particular tester.
One-party commission and full cycle
The commission for one party is debited separately when opening and closing a position. If the tariff is $1 per contract per side, a full cycle will cost $2: $1 at entry and $1 at exit. The commission for the full cycle already includes the entrance and exit, so you do not need to double it further.
Typical error: Real conditions give 0.01 commissions to enter and 0.01 to exit, a full cycle of 0.02. If the tester applies the parameter separately to the input and output, specify 0.01. If you specify 0.02, the final commission will be 0.04, that is, twice the real one. The reverse error occurs when the platform expects a full cycle fee and the user specifies only the value of one side.
Minimum commission and partial executions
Some brokers apply a minimum amount per order. If the tariff is $0.005 per share, but at least $1, a 100-share deal at the tariff would be worth $0.50, and in fact $1 would be written off. For small volumes, the minimum commission dramatically increases relative costs.
A strategy can enter in multiple orders, partially close a position, add volume, use multiple profit goals, or flip a position. The logical transaction strategy, the trading order and the actual execution are different things. If the entry was executed in two orders and the exit in two parts, the model with one commission for the entire transaction can understate the costs.
Scaling strategies need to be carefully checked. For example, the algorithm opens the first part of the position, adds the second when confirming the signal, closes the half on the first target and the remainder on the trailing stop. From the point of view of the trading idea, it is one trade, but from the point of view of the broker, it is several executions. If the commission is debited for each execution, the final costs are higher than for a simple entry and exit with one order.
A reversal of position can also be harder than it seems. If the strategy closes a long position and immediately opens a short one, the tester may reflect this as one change of direction, and the broker as closing one trade and opening another. Commission, spread and slippage should be considered for both parts of the process.
How Spread Works in Strategy Tester
Spread It is the difference between the purchase price and the sale price. The purchase is usually opened at the higher bid price of the seller and the sale at the lower bid price of the buyer. Therefore, a position immediately after opening usually has a small negative result: the price must pass the spread before the trade goes to zero.
Example: purchase price 1,1002, sale price 1,1000, spread 0.0002. Purchase opens at 1,1002, and at immediate closing, the sale will occur at around 1,100. The spread is not written off in a single line, but actually reduces the result through the execution price.
Bid, Ask and Testing at the Same Price
Bid The price at which the participant can sell. Ask The price at which the participant can buy. If the historical data contains only one price, such as the sale price or the conditional average price, the second party must be modeled by adding a spread. This creates the risk of inaccurate execution in the tester.
On the chart, it may appear that the price has not reached the stop loss, but the opposite side of the quote could have activated it. The reverse situation is possible with take profit: the level was visually close, but the actual side of the price did not reach execution. Therefore, the spread in the strategy tester should be applied to the correct side of the quote, not just subtracted from the final profit.
Fixed and floating spread
A fixed spread is convenient for a rough estimate, but often makes the test too optimistic. In real trading, the spread changes: it expands on the news, at night, with low liquidity, during gaps and sharp movements. A strategy that looks good at a constant minimum spread may lose its advantage in a more realistic model.
A floating spread better reflects real trading conditions if the data does contain a bid/ask history or a reliable spread pattern. Its limitation is that not every platform stores quality tick data, and a bad spread history can create both an overly optimistic and overly pessimistic result.
A persistent spread is particularly dangerous for strategies that enter periods of low liquidity. For example, a night algorithm in the foreign exchange market may open trades when the average daily spread no longer reflects reality. If the test uses a 0.8-point spread, and at the time of actual inputs it often expands to 2-4 points, the average trade may disappear.
A practical way to check is to run several spread options: base, average historical, elevated and stressful. If the strategy is stable only with a minimum advertising spread, and with moderate deterioration becomes unprofitable, it cannot be considered ready for a real account without additional filtering of the entry conditions.
What is a trading algorithm slippage
The slipping of a trading algorithm The difference between the expected price of the order and the actual price of the execution. It occurs due to delay in sending an order, price changes before execution, insufficient liquidity, partial execution or market movement at the time of news release. Slippage is different from delay: delay is the cause, slippage is the result in price.
A market order is usually executed quickly but does not guarantee a price. A stop order after activation often turns into a market order and can be executed worse than the foot level. Limit order limits the price, but does not guarantee execution: if the market only touched the level on the candle, this does not mean that the queue of orders had enough liquidity for your volume.
Slippage can be positive and negative, but in stressful situations it is the negative side that is more often interested. If a algorithm puts a stop loss at 100.00, it doesn’t mean that the shutdown will always occur at exactly 100.00. With a gap, a sharp pulse, or a thin glass, the actual price can be worse. Therefore, the statement “stop loss always limits a loss to an exact amount” is incorrect.
Delay in execution is a separate factor. The signal can appear in the terminal, then the order is sent to the server, processed, gets to the broker or the exchange and executed at an affordable price. Even a fraction of a second delay can be significant for scalping, but almost imperceptible for long-term strategy. Therefore, the slippage model must match the frequency of trading and the type of orders.
Limitation of historical timetable
Touching the price on a historical candle does not guarantee the execution of a limit order.
Execution of market, stop and limit orders
Market order
It is executed quickly at an affordable price. Risk: The price may be worse than expected.
Stop order.
It is activated upon reaching a level and can be executed with slippage.
Limit order
Limits the price, but may not be fulfilled completely or at all.
In a tester, it is important to model different types of orders differently. Zero slippage for all trades is rarely realistic. But too rough a constant slip can skew the outcome if the strategy uses different tools, trading hours, and order types. It’s best to check multiple scenarios and then calibrate the model by actual trades.
For limit orders, it is important to distinguish between level touch and actual execution. If the candle showed a minimum of 100.00, and the purchase limit was 100.00, this does not prove that the application was executed. Perhaps a small volume passed at this price, the queue was in front, or the price touched the level only in a quotation not sufficient for the actual transaction. A conservative model may require a price to pass above the limit or take into account the probability of a skip.
For stop orders, the reverse problem is that the historical graph may show the level of the foot, but the actual performance will be worse. In fast movements, a stop protects against endless holding a position, but does not guarantee an exact exit price. This is especially important for strategies where one large stop can significantly affect the monthly result.
Swaps and position financing
Swaps, financing, and position transfer fees are important for strategies that keep trades longer than one day. In the foreign exchange and CFD markets, the transfer can result in daily accruals or write-offs. There may be a cost of borrowing for short positions. For cryptocurrency derivatives, funding can be a significant factor.
A common mistake is to consider these costs insignificant because they are small in a single trade. If the strategy holds positions for weeks or months, the accumulated effect can significantly reduce the result. This is especially important for systems that trade high-funded instruments or often hold a position through a triple-swap date.
In the backtest, check whether the platform supports historical swap rates or uses a fixed value. A fixed model may be sufficient for rough valuation, but it does not reflect periods of change in rates, crisis liquidity and different conditions at brokers. If the strategy is sensitive to retention, swaps should be included in the stress test along with commission and spread.
What are the costs of different markets
In the foreign exchange market, the main load is often hidden in spreads, commissions, and swaps. In futures, the commission for the contract, exchange and clearing fees, the cost of the tick and the liquidity of a particular contract are important. In the stock market there are minimal commissions, fees for borrowing shares and partial executions. In the cryptocurrency market, you need to take into account the maker/taker commission, funding, different depth of the glass and sharp changes in liquidity.
You can’t transfer the rates of one broker or market to all strategies. The scalping algorithm on CFDs, the intraday futures system, and the day-to-day strategy on stocks all have different sources of costs. The smaller the average trade and the higher the frequency of trading, the stronger the impact of commission, spread and slippage.
A futures strategy may have transparent fees and exchange fees, but face limited liquidity on long-distance contracts. A currency algorithm may not see a separate commission, but pay with a wide floating spread. A promotional strategy can be profitable on large volumes, but lose effectiveness with minimal commissions on small transactions. The cryptocurrency system can work well on one exchange and dramatically worse on another due to the depth of the glass and funding.
Therefore, it is important to indicate the market, instrument, broker, account type, account currency, commission model, source of quotations and execution mode. Without this, it is difficult to transfer the result to another account. Even if the trading logic is the same, infrastructure conditions can make the practical outcome different.
How the Average Deal Related to Costs
The average transaction should have a margin of relative total trading costs. If the backtest strategy earns an average of $8 per trade and the commission, spread and realistic slippage are $6, the margin is very small. A slight deterioration in performance can turn a positive expectation into zero or negative.
Example of manual calculation
Net result = gross profit - commission - spread - slippage - swaps
- Gross profit of the transaction: $40.
- Entry + Exit Commission: $6.
- Cost of spread: $8.
- Slip in and out: $10.
- Net result: 40 - 6 - 8 - 10 = 16 dollars.
Safety margin
If the average trade is comparable to trading costs, the real advantage of the strategy may disappear.
Scalping and high-frequency strategies are particularly sensitive to this relationship. If the algorithm takes short movements and closes trades quickly, one extra tenth of a spread point or a slight slippage can take a significant portion of the benefit. For such systems, it is important to test not only the average result, but also the distribution of transactions: how many transactions remain profitable after a deterioration in execution, how the series of losses changes, and whether the strategy becomes dependent on ideal conditions.
For medium- and long-term systems, costs usually take up a smaller share of the target movement, but they cannot be completely ignored. Commissions, swaps, financing and quotation differences can accumulate for months. In addition, rare trades yield less statistics, so a single error in the execution model can noticeably change the output across the entire strategy.
Typical Tester Setting Mistakes
The most common mistake is to include a commission, but it is wrong to choose a unit of measurement. For example, a user enters a full cycle fee into a field where the platform expects a one-party fee. Or vice versa: specifies the value of one side where the tester deducts the amount only once for entry and exit. In both cases, the result may be significantly different from the actual conditions.
The second mistake is to use a constant minimum spread. Such a test can be useful as an optimistic benchmark, but it cannot be considered a complete test. If a strategy trades during periods of spread expansion, a fixed value smooths out exactly those moments where real spending is most painful.
The third mistake is to consider the limit order executed at any touch of the price. In real trading, there is a queue of orders, the available volume and the speed of the market movement. If the tester executes all the limits perfectly, it can overstate the number of trades, improve the average price and make the strategy more stable than it will be in the account.
The fourth mistake is not to check one trade manually. Even if the settings seem to be correct, manual verification of input, output, commission, spread, and net result quickly shows exactly how the platform is applying costs. Without such verification, it is easy to build dozens of reports on the wrong baseline model.
Commission stress test, spread and slippage
The strategy must be tested not only on baseline conditions but also on moderately degraded scenarios. This is not an attempt to guess the exact future, but a way to understand whether trading logic has a margin of safety. If a small increase in spread or slippage completely destroys profits, such a strategy is difficult to implement reliably in a real account.
Current tariff
Average historical
Minimum realistic
Including fees
Floating
By type of warrant
Above the base.
Expanded
Worse in fast markets
The stress test is useful to combine with Monte Carlo for trading strategies: accidentally change the order of transactions, worsen individual executions, increase the spread in part of transactions and watch how the drawdown, average transaction and final return change.
Don’t make the stress test absurd. If the costs are increased so much that no realistic strategy can pass the test, the test stops helping. Its task is to assess the plausible deterioration: spread expansion in active hours, several slip tics, partial skipping of limit orders, commission growth or a less profitable swap.
A good sign is that the strategy maintains positive expectation in a realistic scenario and does not break down instantly in moderate stress. A bad sign is that profits are completely dependent on zero slippage, minimum spread and perfect execution of all limit orders. This result can be technically beautiful, but almost fragile.
How to compare backtesting with real trading
Even a quality backtest doesn’t have to be exactly the same as a real trade. Differences can arise due to quotes, order queues, delays, slippage, partial execution, differences between the broker’s server and test history. The task is not a perfect coincidence, but to ensure that the deviations are clear and do not destroy the advantage of the strategy.
Compare model and real trades by signal time, entry price, exit price, commission, spread, slippage, order type and reason for closing. If real trades are systematically worse than the model, the backtest needs to be calibrated. If some of the limit inputs are not executed in reality, you can not consider the test, where all the touches of the level give a trade, quite conservative.
For calibration, it is useful to keep a performance log. It records the expected price, actual price, delay, spread at the time of entry, order type, volume, partial execution and the reason for the rejection. After a few dozen or hundreds of trades, you can estimate the average slippage, the worst cases, the share of missed limit orders and the actual commission.
After that, the tester model needs to be updated. If the real average entry price is worse by 0.6 points and the test only takes into account 0.1, the historical result is too optimistic. If limit orders are executed only in 70% of cases, the test with the execution of each level touch overstates the number of transactions and can distort all statistics.
It is important to do this along with the analysis. performance of the trading algorithm, maximum drawdown, re-optimization and off-sample.
How to reduce the impact of trade costs
You can reduce the impact of expenses in several ways: remove weak signals, increase the minimum expected movement, avoid trading with an extended spread, add a liquidity filter, do not enter immediately before the news, choose more liquid hours, control the size of the order and choose a broker with a suitable tariff model.
A limit order is not always better than a market order. It reduces the risk of a bad price, but increases the risk of no execution. A market order increases the probability of entry, but can give a worse price. The choice of order type should be consistent with strategy, liquidity and the risk of missing the transaction.
How to properly adjust trading costs
- Identify all costs. Not limited to the advertising value of the spread or commission.
- Check commission units. A party, full cycle, lot, contract, order or execution.
- Set up a realistic spread. Use historical bid/ask data whenever possible.
- Add a slip pattern. Separate market, stop and limit orders.
- Consider swaps and funding. Especially for long-term positions.
- Check one deal manually. Make sure that the tester deducts costs correctly.
- Compare scenarios. Basic, realistic and stressful.
- Run a forward test. Collect actual performance statistics.
- Calibrate the model. Set up a test on real trades, not hope.
Final checklist
- Whether the commission is in the backtest.
- Whether it’s one side or a full cycle.
- Minimum commissions and exchange fees are taken into account.
- Partial entrances and exits are included.
- Is a realistic spread being used?
- Whether the spread widening has been checked.
- Whether the correct side of the quote is used.
- Is the slipping simulated?
- Whether the order types are different.
- Does not limit order count as executed upon any touch?
- Whether swaps and funding are included.
- Checked whether the cost of the item or tick.
- Does the average transaction exceed the full cost?
- Was there a stress test?
- Were test and real performances compared?
Submissions on the topic
Conclusion
Commission, spread, and slippage reduce the mathematical expectation of a strategy. Incorrect commission setting can both understate and overstate costs, and a constant minimum spread often makes the test too optimistic. Market and stop orders can be executed worse than expected price, and limit order limits the price, but does not guarantee a transaction.
Scalping and high-frequency strategies are particularly cost sensitive because their average deal is often small. A stable algorithm must withstand moderate deterioration in trading conditions, and the backtest model must be calibrated to actual trades on a demo or real minimum volume.
Professional development of a trading algorithm involves not only finding profitable logic, but also checking its feasibility after all the real trading costs. A quality backtest should be conservative, realistic, and rigorous enough that a weak strategy doesn’t look strong just because of zero costs.