Algorithmic strategies This is not a set of beautiful indicators or a magical setup of a trading algorithm. These are formalized rules that a program can execute without a trader’s subjective decision: when to open a position, when to close it, how much to use, how to limit risk, what data to consider and when not to trade.
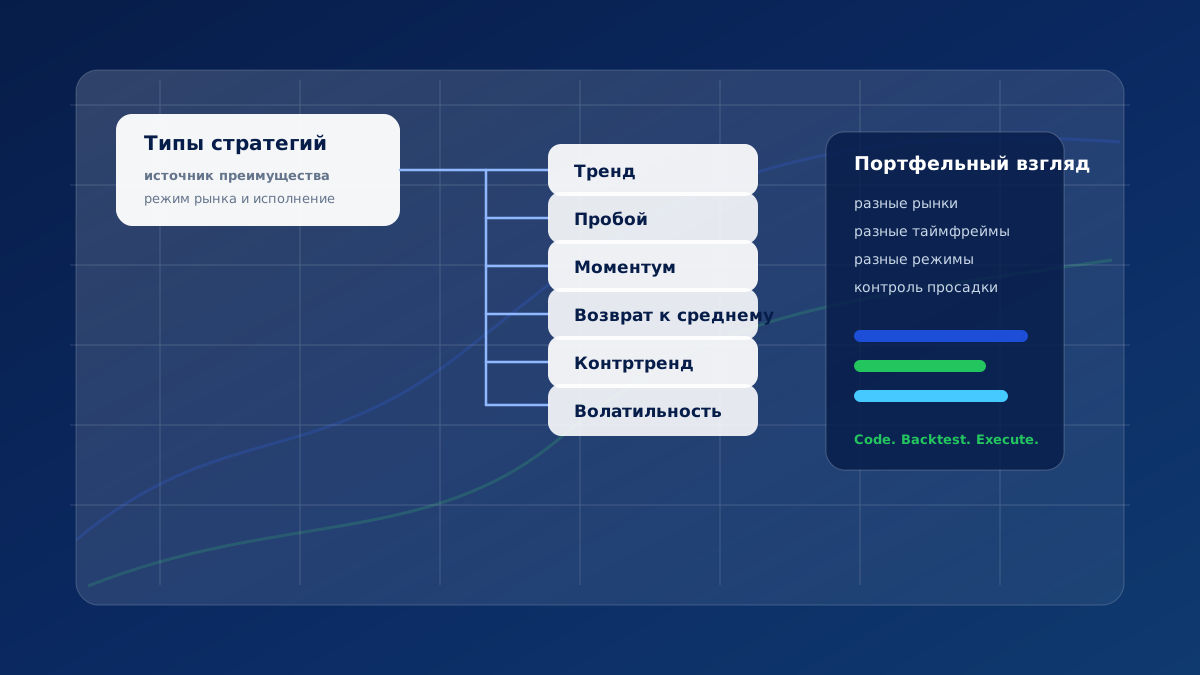
When they talk about Types of trading strategiesThey usually have in mind the main logic of getting an advantage. Some systems try to keep the directional movement. Others enter after breaking the range. Still others buy after a strong deviation from the average price. The fourth works with changes in volatility, calendar effects, statistical connections or intermarket signals.
Classifications overlap. One algorithm can simultaneously be breakout, trending, intraday and working on expanding volatility. The type of strategy helps to understand the nature of trades, typical drawdowns and suitable market regimes, but does not describe the algorithm in full. So the question is not what is the best approach, but what is the source of the benefit, what risks we take, and how the strategy will fit with the rest of the portfolio.
What is an Algorithmic Trading Strategy
Algorithmic trading strategy is a set of formal rules that can be uniquely executed by a program. There is no such thing as “enter if the market looks strong.” Instead, there should be specific conditions: for example, the closing price is above the 100-day average, the ATR is above the average for the year, the spread does not exceed a predetermined limit, the risk of a trade is 0.5% of capital, the position is closed at a trailing stop or reverse signal.
Rules may include entry conditions, position direction, order type, position size, stop loss, take profit, trailing stop, time filter, volatility filter, spread limitation, re-entry conditions and maximum portfolio risk. The more accurately the rules are described, the less space there is for subjective interpretation and the easier it is to test an idea against historical data.
It is important to separate strategy from trading algorithm. Strategy is logic and rules. A trading algorithm is a software implementation of this logic in MetaTrader, StrategyQuant, TradeStation, MultiCharts, Python, or another environment. One strategy can be implemented on multiple platforms, and one algorithm can contain several models: for example, a trending module for indices, a return to the average for currency pairs, and a volatility filter to turn off trading in dangerous modes.
This separation is useful both when buying a ready-made algorithm, and when developing your own system. The investor does not evaluate the name of the algorithm, but what trading hypothesis is embedded inside, how it is executed, what risks it limits and whether the result can be reproduced on independent data.
The name doesn't equal the quality.
The name of the strategy does not determine its reliability. Reliability is only confirmed by testing, out-of-sample verification, realistic costs and matching with real trading.
How to classify trading strategies
Algorithmic trading strategies can be classified according to several criteria. The most useful classification for the investor and developer is based on the source of the trading advantage: following the trend, breakdown, momentum, return to the average, countertrend, volatility, seasonality, arbitrage or statistical dependencies.
There is a classification by retention time: high-frequency, scalping, intraday, medium and long-term models. The same principle may work across different horizons, but the requirements for data, execution, and average transaction will vary. Breaking the daily range and breaking the annual high are both breakout approaches, but they are almost different worlds in terms of transaction frequency and trading costs.
Strategies also vary in direction: only purchases, only sales, two-way models and market-neutral designs. By data type, they can be price, volume, fundamental, news, intermarket, based on a book of orders or option data. The following article classifies the types of trading strategies primarily by trading logic, because it explains the behavior of the system in different market regimes.
Brief catalog of algorithmic strategies
This table is a fast navigator. It is not a substitute for detailed testing, but it helps to understand where different types of algorithmic strategies tend to feel stronger and where they have the greatest risk.
Continuing sustainable movement.
Strong trend.
A series of false signals in the side market.
Extending the price beyond the range.
Increased movement and volatility.
False breakdown.
Maintaining strong momentum.
Sustained price acceleration.
A sharp reversal.
Return of the price after rejection.
Side market.
Creating a new trend.
Deal against current movement.
Traffic exhaustion.
Early entry against strong trend.
Changes in the level of price fluctuations.
Transition from compression to expansion.
Regime definition error.
Trade from corridor boundaries.
Stable side market.
Range breakdown.
The discrepancy between related prices.
Temporary inefficiency.
Implementation and infrastructure.
Repeated calendar effect.
Stable seasonality.
Disappearance of pattern.
A real automatic trading system can combine several approaches. For example, entry after breaking a 20-day high with a high ADX simultaneously refers to breakout, trending and momentum patterns. For classification, it is useful to identify the main source of advantage, rather than trying to glue only one formal label to the algorithm.
Trend strategy
Trend strategy He opens a position in the direction of the already formed movement and expects that the movement will continue. Its basic principle is simple: buy in a rising market, sell in a falling market and hold a position until the trend weakens or reverses.
Typical entry logic involves crossing moving averages, finding the price above or below the long average, breaking the previous high or low, turning SuperTrend, positive linear regression slope, or confirming ADX. The output can be based on the reverse signal, trailing stop, exit through the channel, the foot on the ATR, the intersection of the middle or fixed protective foot.
Trend trading algorithm works better in periods of long directional movement, steady changes in the economic regime, high directional momentum and in markets prone to long trends. A classic example is a system that buys futures after exiting above a long-term high and holds a position until the price breaks through the lower bound of the channel.
The weak side of the trend approach is the side market. If the price is reversed frequently, the strategy can get a long series of small losses. The percentage of profitable trades is often below average, and a large portion of the profits come from rare large movements. For the investor, this means psychologically unpleasant waiting periods, a return of some of the open profit, and the need to withstand the usual drawdowns without prematurely shutting down the system.
The advantage of trending strategies is that they can capture large movements and apply to different markets: indices, commodities, currencies, bonds, CFDs and futures. The risk is that late entry and late exit can make the outcome vulnerable to trading costs, especially at short intervals.
Breakthrough strategy
Breakthrough strategy opens a position after the price is released beyond a predetermined limit. Such a limit can be a maximum, minimum, price channel, daily range, support or resistance level, consolidation border or trading session extreme.
The basic idea is that once out of range, the market can move into a new directional movement. Typical inputs: breakdown of the Donchian channel, breakdown of the maximum or minimum for N periods, exit from the Asian range, breakdown of the range of the previous day, stop order above or below the level, breakdown after compression of volatility.
Outputs are most often built on a protective foot, return the price to the range, achieve the goal, trailing stop or time filter. A breakout trading algorithm is particularly sensitive to execution: if the entry is through a stop order during a fast movement, the actual price may be worse than expected. Therefore, a realistic model is important for breakdown systems. commissions, spreads and slippages in backtest.
The best conditions for breaking down are the start of a new trend, exit after consolidation, increased volatility, and strong news or fundamental momentum. The main risk is a false breakout: the price briefly goes abroad, activates the entry, and then quickly returns inside the range. Such situations are especially common in the side market and with low liquidity.
A breakout strategy can be trendy if it enters the direction of long-term movement; neutral if it places orders in both directions in advance; and volatile if its main logic is the transition from contraction to expansion. Therefore, the word “breakdown” describes the nature of the entry, but does not always fully explain the source of the advantage.
Momentum strategy
Momentum is trading on maintaining price momentum. Momentum strategy It assumes that an asset showing a strong movement can continue in the same direction. Unlike a trend, momentum describes not only the direction, but also the strength, speed, or acceleration of a movement.
The trend can persist even with a temporary weakening of momentum. Momentum, on the other hand, often focuses on periods of apparent acceleration. Typical signals: high yield over the last N periods, price acceleration, Momentum and Rate of Change indicators, RSI with momentum continuation logic, exit from the range with volume growth, relative strength of the instrument or ranking of a group of assets.
There are several options. Absolute momentum evaluates the movement of the instrument itself. The relative momentum selects the strongest assets from the group. Time Momentum compares the current price with the past. Intraday momentum uses a short price acceleration within the trading session. For portfolio management, ranking is often used: for example, once a month to buy several futures or ETFs with the best dynamics in recent months.
Momentum systems work better with a steady continuation of movement, increased market participation, pronounced instrument leadership and strong intermarket momentum. Their risks are a sharp reversal, late entry, sensitivity to costs at small intervals, re-optimization of the measurement period and the accumulation of similar positions in the portfolio.
If multiple algorithms buy the same asset after a similar acceleration, the portfolio may appear diversified only on paper. In reality, drawdowns will coincide because the source of risk is the same.
A return to average strategy
Mean reversion is the return of the price to the average value. A return to average strategy It assumes that after a strong deviation, the price often returns to some normal level. The average level can be the moving average, median price, VWAP, central range line, statistical average or equilibrium price of the associated asset.
The typical logic is as follows: the price has deviated from the average level, the indicator shows overbought or oversold, the strategy enters against the deviation, and the position closes after returning to the normal zone. Bollinger Bands, RSI, standard deviation, z-estimation, deviation from the moving average, channels and spread between related assets are used as tools.
This logic works better in the side market, with temporary price distortions, in a stable range, on liquid instruments and with recurring short-term deviations. In practice, the strategy can buy after the price exits below the lower Bollinger band and close a position near the middle line if the market filter shows the absence of a strong trend.
The main risk is that what looks like a temporary deviation could be the start of a new trend. If the algorithm enters against the movement early, averages the losing position and has no protective stop, a small series of trades can turn into a large drawdown. Therefore, a return to the mean does not automatically mean a martingale. A sustainable strategy can use one input, a limited stop loss, and a fixed risk. More about this approach, there is a separate material about trading-algorithm.
For such systems, data quality, realistic spread, liquidity and verification on different modes are especially important. The side market is not eternal: when the regime changes, the old average price may cease to be a guide.
Counter-trend strategy
Counter-trend strategy opens a position against the current directional movement in anticipation of correction or reversal. It often overlaps with a return to the mean, but it is not the same thing. The return to the average relies on a statistical deviation, and the countertrend approach may look for trend depletion, false breakdown, or reversal from a strong level.
Typical signals: divergence, extreme overboughtness, false breakdown, candlestick reversal, decrease in volume in the direction of the trend, reaching a strong zone, slowing momentum or going beyond the statistical range. The entry may not be aimed at a complete trend reversal, but at a short correction within a larger movement.
The best conditions are motion exhaustion, return from a strong level, false breakdown and short-term correction within the range. The risks are obvious: early entry, trading against a strong trend, several consecutive stops, trying to guess the top or bottom, and using averaging instead of limiting a loss.
Counter-trend entry requires particularly tight risk control because the market can continue to move much longer than expected. If a trend is supported by a fundamental factor, liquidity, or panic of participants, a technical reversal signal may be premature. Therefore, in countertrend systems, regime filters, limiting the risk of a transaction and clear terms of cancellation of an idea are important.
For an investor, countertrend models can be useful as part of a portfolio, but they can’t be valued by a high percentage of profitable trades alone. Often, such strategies yield many small gains and rare large losses, so tail risks analysis is needed. Maximum Drawdown of Trading Strategy.
Strategy on volatility
Strategy on volatility It uses not only the direction of the price, but also the change in the strength of price fluctuations. Low volatility means relatively small movements, high – fast and wide fluctuations. Crunch periods are often followed by expansion, and extremely high volatility may decrease over time.
Volatility expansion trading enters after the market exits from a calm state: breakdown after a narrow range, growth of ATR, expansion of Bollinger bands, exit after an internal bar or breakdown of a low volatility range. Volatility compression trading, on the contrary, prepares for the start of movement after an unusually calm period. The return of volatility uses the assumption that extreme values return to normal levels over time.
Option strategies are also associated with volatility, but the result depends not only on the direction of the price, but also on the change in expected volatility, the time before expiration and the structure of option premiums. In this review article, it is important to understand the principle that the source of the advantage may not be in the up or down forecast, but in the assessment of the transition of the market from one mode of fluctuations to another.
Risks of volatile systems are false expansion, late entry, spread and slippage growth, regime definition error and a sharp reversal after momentum. If the strategy trades a breakdown after the ATR compression but does not account for news spread expansions, the historical returns can be grossly inflated.
Range strategy
Range strategy Trades within the price range: buys near the lower bound, sells or closes a position near the upper, and sometimes opens short positions from the upper limit. It is often a kind of return to the mean, but it is convenient to distinguish it separately because of the understandable geometry of the levels.
Typical tools: support and resistance, RSI, Bollinger Bands, Donchian channel with reverse logic, average range price, low ADX filter and stable volatility filter. The strategy works best when the market is actually held in a corridor and the boundaries are confirmed by repeated price reactions.
The main risk is a real breakdown of the range. If the algorithm continues to buy the bottom line when the market has already gone down, a series of small trades can quickly turn into a large loss. Additional risks: subjective choice of boundaries, change in range width, increase in volatility and accumulation of losses during averaging.
Range systems require a clear rule when the previous range is no longer valid. This could be a closure abroad, an ATR rise, a high ADX, a news filter, or a limit on the number of failed repeat entries. Without such a rule, a range strategy turns into a hope that the market will inevitably come back.
Classification by retention time
High-frequency strategies perform a very large number of operations, hold positions for minimal time, and are critically dependent on infrastructure, delay, and commission. They cannot be used synonymously with any scalping: the true HFT model requires a different technological base.
Scalping strategies don’t last long and usually have a small average profit. Because of this, they are particularly sensitive to spread, commission and slippage. Intraday strategies usually close positions for the rest of the day, avoiding the risk of carrying them through the night, but depend on intraday liquidity and execution quality.
Medium-term strategies hold positions for days to weeks. Long-terms can hold positions for months. The same trading principle can be applied at different intervals, but conclusions on one timeframe cannot be automatically transferred to another.
How strategies overlap
One strategy can be of several types. Buying after breaking a 20-day high with a high ADX can be breakout, trendy and momentary. Buying after exiting below Bollinger's band with a target on the middle line can be a return to the mid, countertrend and range model. Entry after compression of the ATR and breakdown of the daily range refers to volatility, breakdown and possibly trend.
The main source of trading advantage should be identified for classification, rather than trying to assign a single label to a strategy. If profit appears mainly after the price exits the compressed range, volatility and breakdown are more important than a specific indicator. If the outcome depends on choosing the strongest assets, the underlying logic is closer to relative momentum.
Comparison of major strategies
The following table shows typical properties. These are not norms or promises. The specific implementation can vary greatly, and a high percentage of profitable trades does not mean less risk.
In motion.
Often below average.
Side market.
Out of range.
Medium or low.
False breakdowns.
Strong impulse.
Depends on implementation.
A sharp reversal.
Against deflection.
Often tall.
Strong new trend.
Against traffic.
Medium.
Early entrance.
Depends on the model.
Different.
Regime error.
From range limits.
Often tall.
Corridor breakdown.
There is no universal regime
There is no type of strategy that works equally well in all market regimes. The task of the portfolio is to combine different sources of advantage and control overall risk.
How to Choose a Type of Trading Strategy
The choice depends on the market, time slot, available data, trading costs, allowable drawdown, frequency of transactions, short selling opportunities, infrastructure and portfolio objectives. You can’t choose an approach based only on the maximum historical profit: a beautiful backtest can be the result of over-optimization, wrong costs or a successful market period.
Practical questions before development: in what market will the algorithm work; whether the market is inclined to trend or return to the average; what is the typical spread; how much history is available; whether there are enough transactions for statistics; what is the expected average trade; whether long series of losses are permissible; whether it is necessary to close positions inside the day; how the strategy will be combined with other algorithms; whether it is possible to realistically simulate the execution.
If the strategy trades frequently and the average trade is small, costs can wipe out the advantage. If there are few transactions, the statistics can be unreliable. If the drawdown is historically small, check to see if it was hidden by martingale, averaging, or too short a testing period. To assess the already ready system useful checklist from the article How to evaluate a trading algorithm by indicators.
What strategies to combine in a portfolio
A portfolio of trading algorithms should combine different sources of trading advantage. A useful combination can include a trending strategy, a return to the average, a breakdown of volatility, a model in another market, and a strategy in another time frame. Names alone do not guarantee diversification.
Three trend algorithms on the US indices can lose simultaneously. Breakthrough and momentary strategy can actually use the same trades. Different instruments can be strongly correlated in a stressful market. Therefore, you need to check the correlation of returns, the coincidence of drawdowns, simultaneous open risk, dependence on one regime and concentration on one asset class.
The topic of portfolio combination is detailed in the article about Diversification of strategies in algorithmic trading. Here it is enough to fix the main principle: a good portfolio is built not from a large number of similar algorithms, but from proven models with different sources of risk and profit.
How to test an algorithmic strategy
Any type of strategy must be translated from an idea to a testable hypothesis. First, the reason why the pattern may exist is formulated. Then formal rules for entry, exit, position size and risk limitation are created. After that, realistic costs are adjusted: commission, spread, slippage, swaps and execution features.
Then the historical test is carried out at sufficient depth and different market regimes. It is important to analyze return, maximum drawdown, Profit Factor, mathematical expectation, average trade and number of trades. Detailed order described in the material How to Backtest a Trading Strategy.
The next step is to check the re-optimization. Parameters should be stable, and not selected for one successful site. It is useful to read an article about re-optimizing the trading strategy. Then, the test is performed outside the sample and Walk-Forward Analysisand Monte Carlo for trading strategiesto evaluate possible drawdown options, sequence of transactions and margin of safety.
The final stage is a forward test and comparison of real transactions with model ones. Only after an independent review does it make sense to add a strategy to a portfolio, with control over overall risk, correlation, and drawdown limits.
Common Mistakes When Choosing a Strategy
- Choose a strategy based only on the total profit and ignore the way in which that profit was generated.
- Use an approach that does not match the market: for example, a range system on a tool with stable trends.
- Ignore trading costs, especially in scalping and breakout models.
- Draw conclusions from too short a history without different market regimes.
- Evaluate the system when there is insufficient number of transactions.
- Re-optimize parameters and take fit for a sustainable advantage.
- Do not conduct an out-of-sample test or forward test.
- Ignore maximum drawdown and capital recovery time.
- Accept a smooth curve as a low risk without analyzing the hidden shoulder and averaging.
- Use martingale to mask weak trading logic.
- Combine similar strategies under the guise of diversification.
- Do not understand the source of the trading advantage.
- Try to use one strategy in all modes.
- Disable the system after a normal loss-making series without checking the historical risk profile.
- Evaluate the approach on only one instrument and transfer the output to the entire market.
Conclusion
The type of strategy determines the source of the trading advantage, the nature of the trades, the typical drawdowns, and the market modes in which the algorithm usually performs better. Trend systems are looking for the continuation of movement, breakout - exit from the range, momentum - preservation of momentum, return to the average - temporary deviation, countertrend - correction or reversal, and strategies for volatility - change in the oscillation regime.
No one type is the best for all markets and periods. The practical task of the developer and investor is to understand the logic of the advantage, test it on data, take into account costs, conduct stress tests and evaluate how the strategy fits with other systems in the portfolio.
Need to check your trading strategy?
ATS helps to evaluate algorithmic strategies, check risk, stability of parameters and portfolio compatibility before capital launch.